Last Updated: 2026-04-06
Purpose
This article provides users with an overview of the portal interface of Scans.
Introduction
In Outscan, the Scans View provides a unified interface showing all executed and ongoing scans, regardless of origin such as Scale, Cloud, Docker. It enables you to monitor scan status progress, explore output like URL lists or charts, navigate to associated findings, and manage workflow scans. By having all scan metadata—duration, status, errors, workflow context—in one consistent view, you gain clearer operational visibility and faster insight into scan health and outcomes.
Requirements
It is assumed that the reader has basic access to the OUTSCAN/HIAB account.
The Scans View
The Scans view presents the details of all scans. To customize the view:
-
Click on the column

All columns are described in the Appendix section at the bottom of this articles -
Add desired columns by checking their box.
-
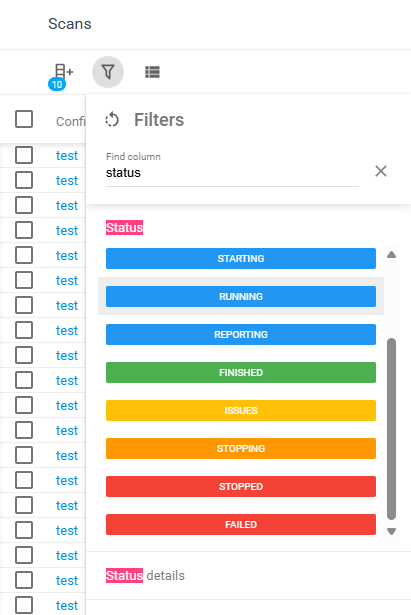
Click on the filter

See Common Settings Panel for more information on how to configure and save a View template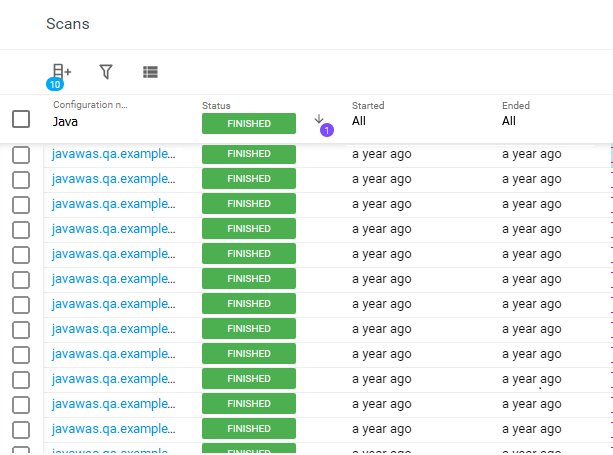
Click on a scan to view the following information about that scan.
Status
Status presents the different stages of the scan along with their duration:
|
Status |
Description |
|---|---|
|
|
The scan schedule has started and is waiting for a slot to start scanning. |
|
|
The scan has been paused. |
|
|
A slot has been assigned to the scan and it is in the process of starting the scan. |
|
|
The scan is currently running. |
|
|
The scanning engine has finished collecting facts, and the reporting tools are currently running. |
|
|
The scan cycle is completed. |
|
|
The scan has encountered some issues. |
|
|
The scan is in the process of stopping. |
|
|
The scan has been manually stopped. |
|
|
The scan has failed to complete its scan cycle. |
If any issues occur during the scan, they are displayed in the Status details column for the issues' title as well as the Status tab for the issues' details
Examples:
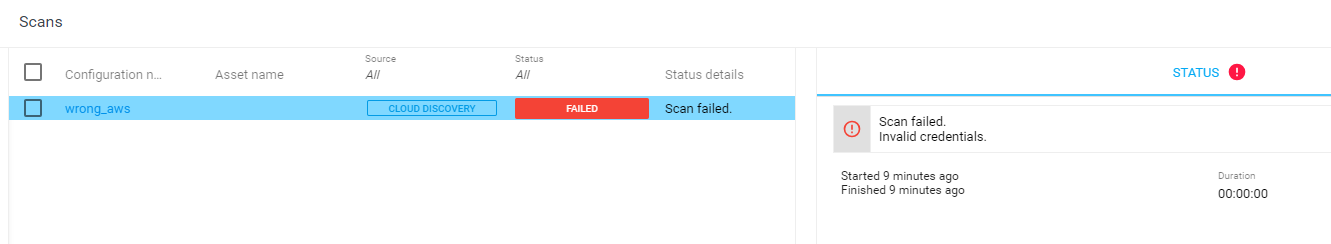
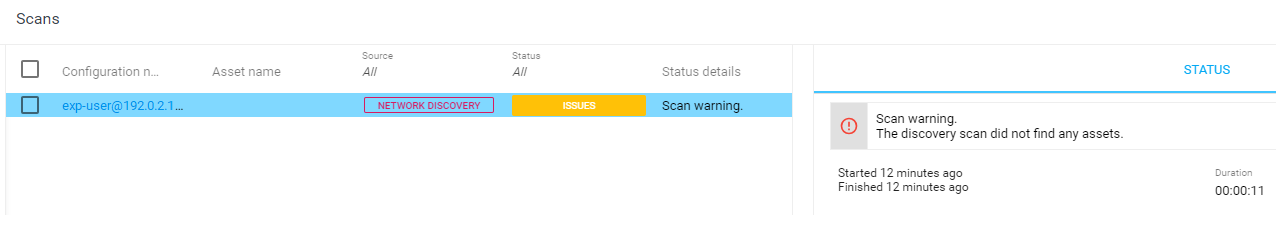
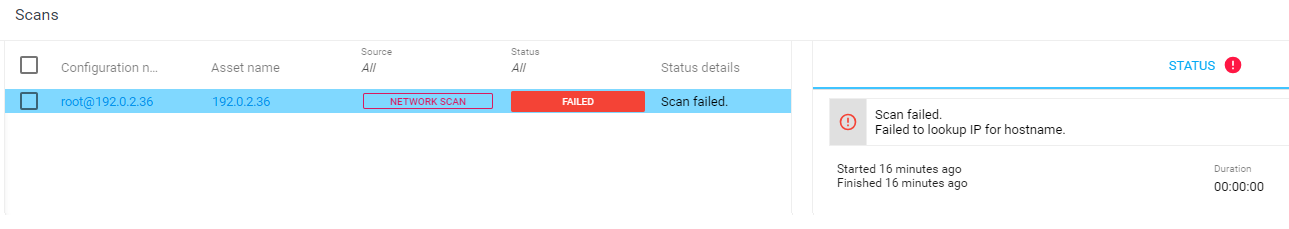
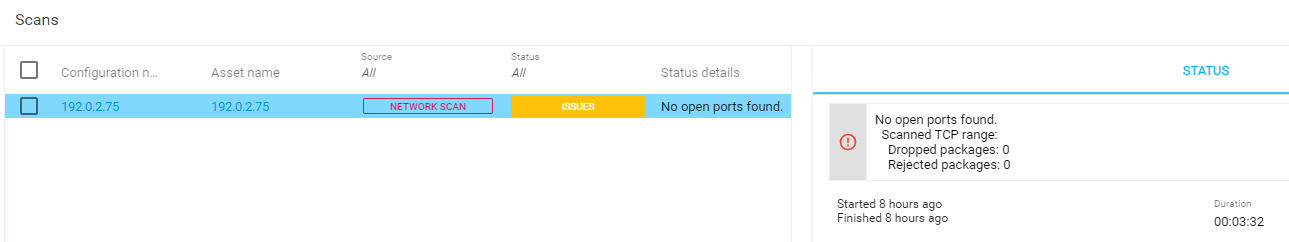
The Scans View will show one or more issues for several scans as shown if there is any issue with the scan regardless of the scan status.
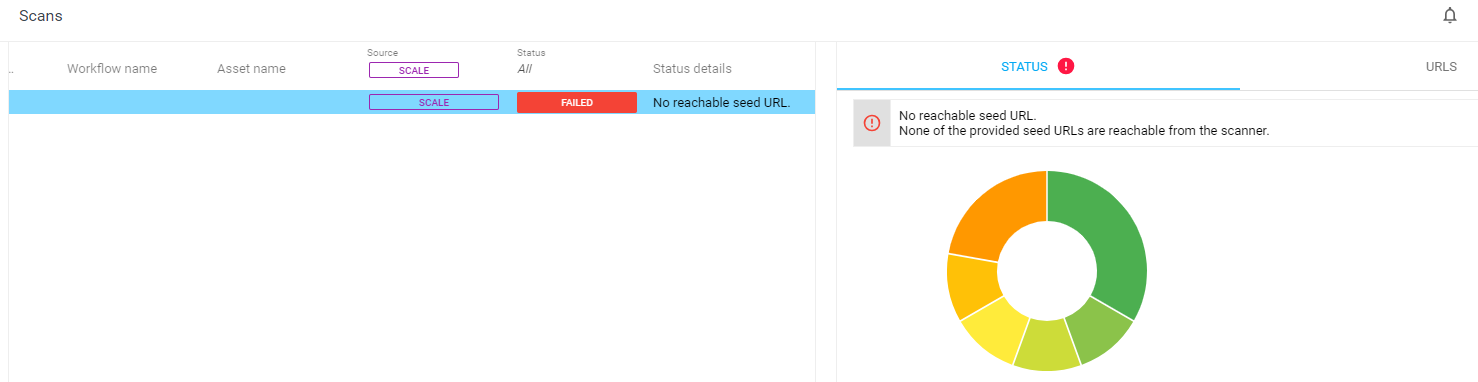
URLs
The output from each scan depends on the source of it, for example, the output from Scale scans will include a sunburst chart and a list of URLs with a detailed breakdown of the scan flow.
Sunburst Chart
The sunburst chart provides a graphical overview of the URLs and by clicking a specific segment the associated URL is copied to the clipboard for further analysis.
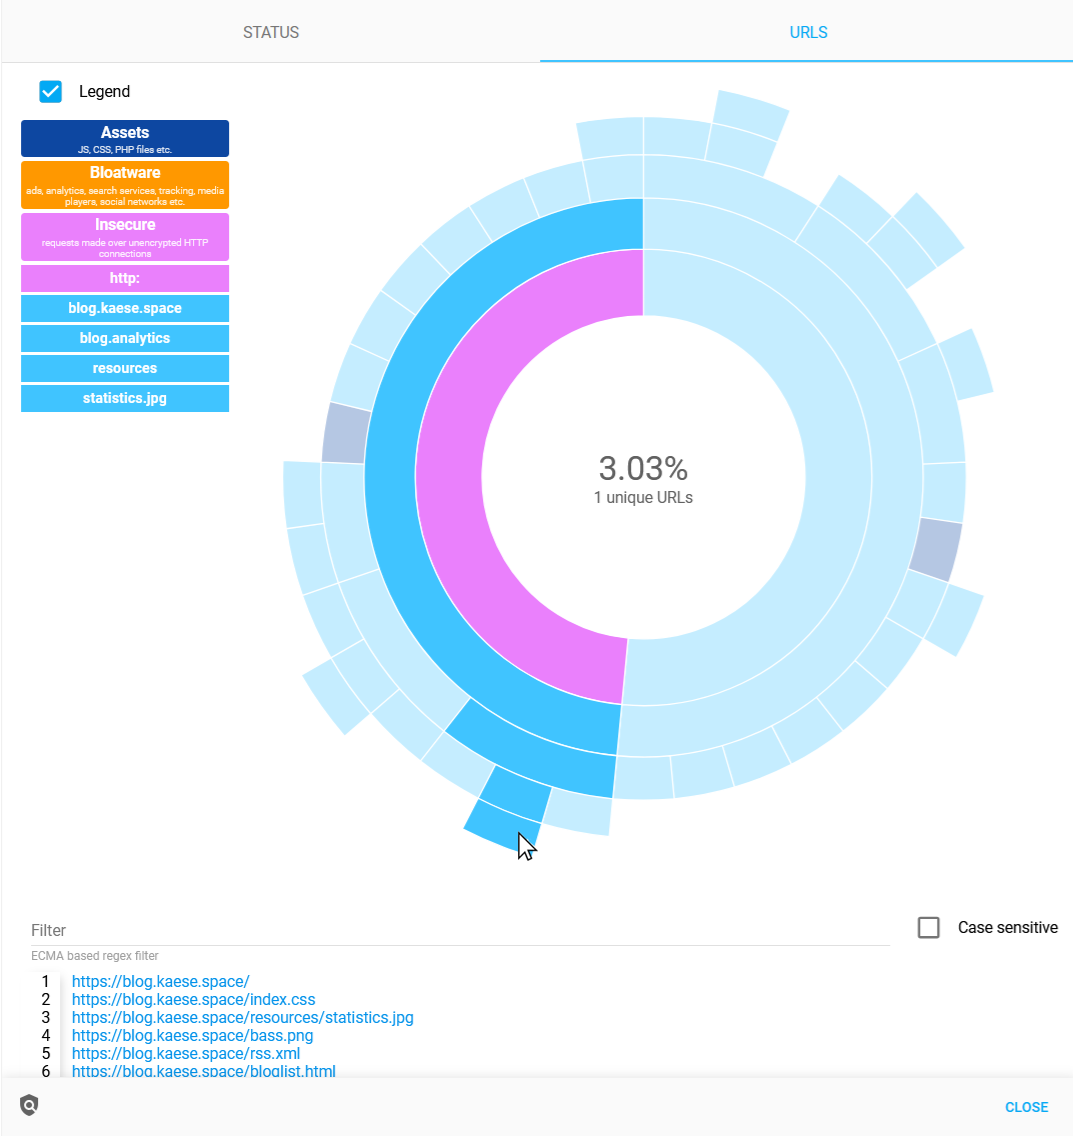
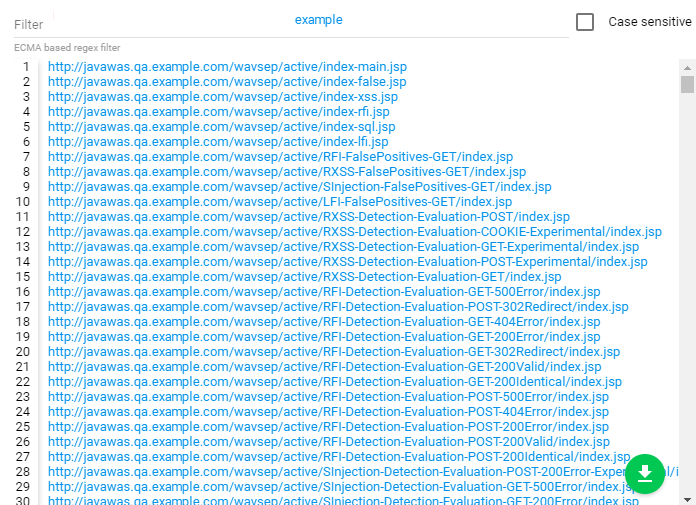
URL-List
The complete URL list can be downloaded to a file by clicking the green Download URLs ![]()
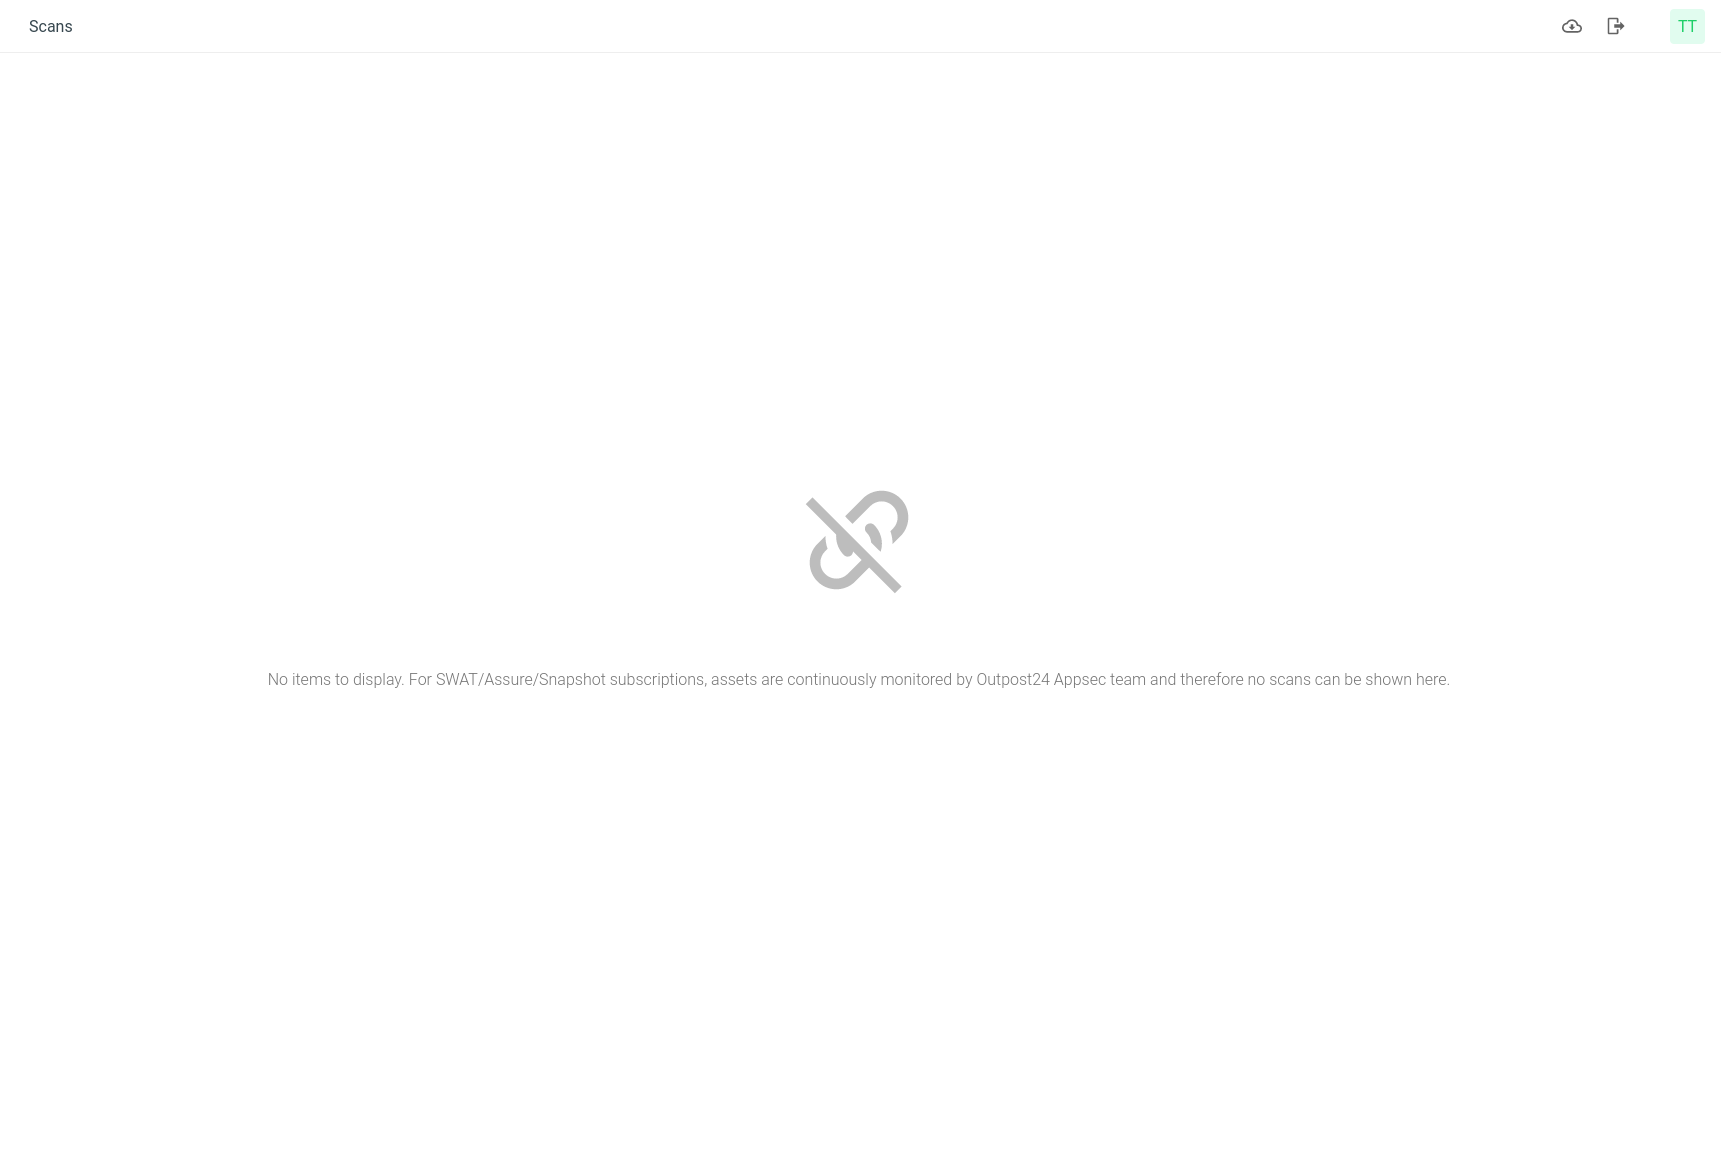
If there are no scans to show the view shows an empty state with the message: "No items to display. For SWAT/Assure/Snapshot subscriptions, assets are continuously monitored by Outpost24 Appsec team and therefore no scans can be shown here."
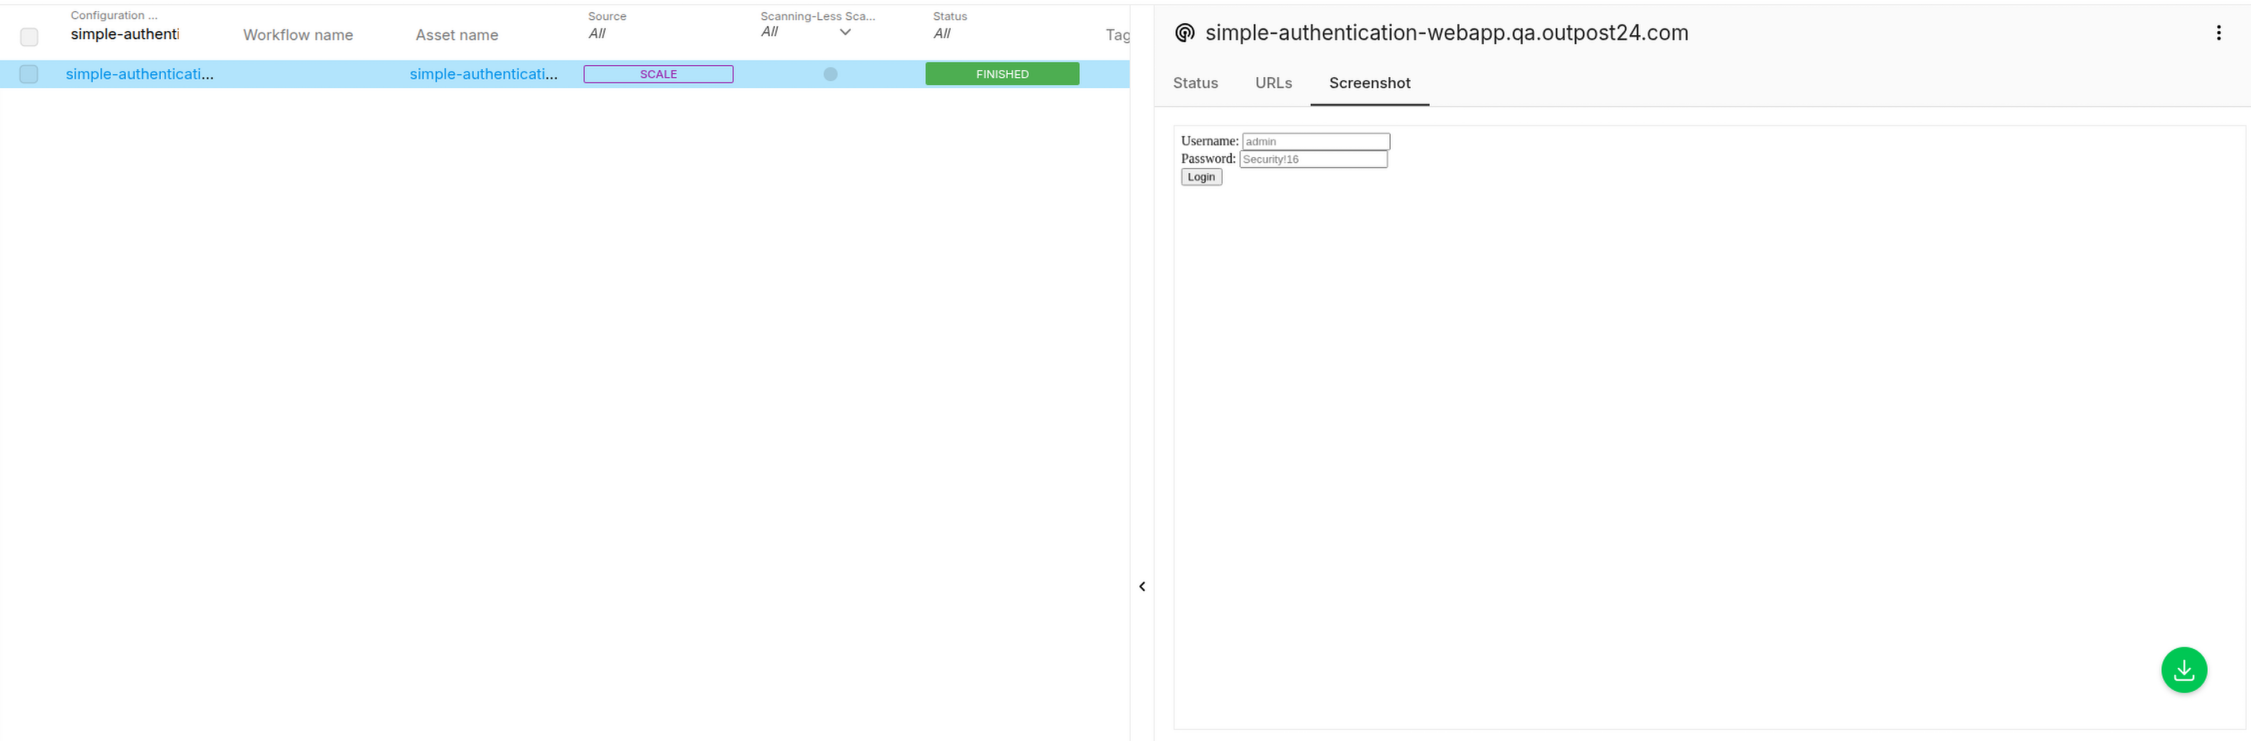
Screenshot
Technical Preview
This section is a technical preview of a feature that is currently under development. This feature is hidden behind a feature flag.
Screenshot displays the website screenshot captured for the selected scan. It is available in the scan’s detailed view for SCALE scans when the DAG SCALE scans feature flag is enabled, and lets users preview and download the image.
Related Findings
To access the related findings for a scan:
-
Select the scan by checking the box on the left hand side of the row.
-
The bottom toolbar is displayed.

-
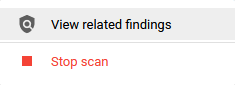
Click the View related findings icon to the right in the tool bar.
You can also right-click on a scan and select View related findings from the context menu.
Both methods bring you to a filtered view for that specific scan.
Workflow Scans
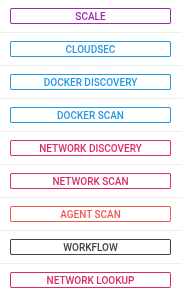
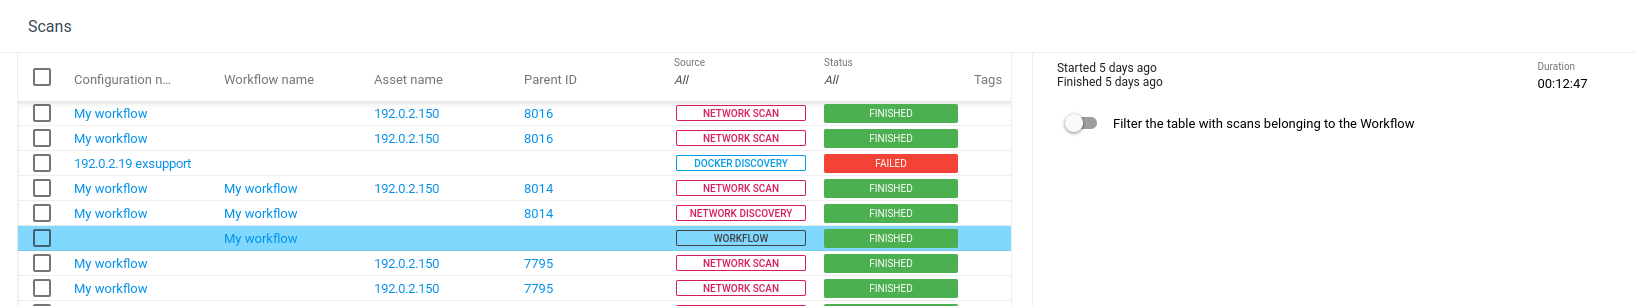
A workflow consists of a chain of scans running after each other. Scans belonging to a workflow display the workflow name in the column Workflow name while the actual workflow is indicated with the word WORKFLOW in the Source column:
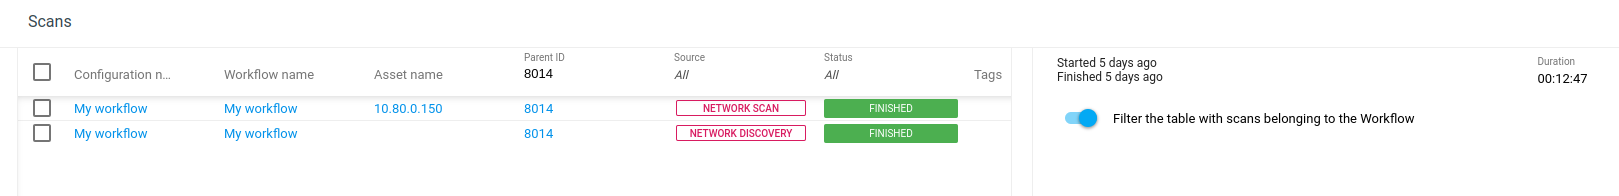
To see the different scans that ran within a workflow scan, select the switch in side panel. The view is filtered on the ParentID, showing the child scans:
Refer to workflows for information on how to configure a workflow.
Starting Scans
Schedule a Scan
Schedules can be created both in Automation > Schedules or in Configuration > Scan Configuration.
Refer to Schedules for information on how to schedule a scan.
Start On-Demand Scan
After configuring the settings, follow the below procedure to perform a scan:
-
Go to the Configurations view.
-
Select the required configuration.
-
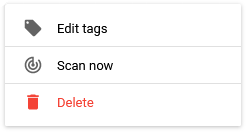
Click on the scan now

-
You will get a popup displaying Successfully scheduled.
All scheduled scans can be viewed in the Scans view.
Stopping a Scan
To stop an ongoing scan:
-
Go to the Scans view.
-
Select one or more scans, and click on the Stop scan


-
You can also right-click on the scan and from the context menu select Stop scan
If a scan is stopped but it is completed before it is stopped then it will report the result of the scan with the status FINISHED instead of STOPPED.
You can submit the Stop scan request for any scheduled scan, but it has an effect on the currently running scans only.
Download Blueprint
See Scan Blueprint for more information.
Appendix
|
Column |
Description |
|---|---|
|
Asset |
Displays the Asset ID number. |
|
Asset name |
Displays the Asset name. |
|
Assigned scanner |
Shows the assigned scanner that where setup in the Scan configurations to perform the scan. |
|
Authentication |
The authentication used in the scan. |
|
Configuration ID |
ID of the Scan configuration. |
|
Configuration name |
Name of the Scan configuration. |
|
Created |
Number of days since the scan was created. |
|
Created by |
Name of the user that created the scan configuration. |
|
Customer ID |
UUID of the user that created the scan configuration. |
|
Ended |
Timestamp when the scan ended. |
|
Expected end |
The scan expected end date. |
|
Expected start |
The scan expected start date. |
|
ID |
Unique identifier. |
|
Invocation ID |
The Invocation ID represents the unique integer ID that allows the user to identify scans that came from the same invocation. |
|
Parent ID |
The ID of the parent scan. |
|
Scanning-Less Scanning |
Indicates if the scan was an Scanning-Less Scan or or a full scan. |
|
Source |
Which source scanner or product type does the asset originate from. See Asset sources section in the Asset article for more information. |
|
Started |
Timestamp when the scan started. |
|
Status |
Presents the different stages of the scan along with their duration. |
|
Status details |
Presents the reason for the Status in greater detail. |
|
Tags |
Displays the available tags associated with the scan. See Tags article for more information. |
|
Targets |
An array of asset identifiers contains both the targeted IP address and the corresponding identifiers that were resolved to that IP. |
|
Updated |
Timestamp of when the asset was last updated at all for any reason, system- or user-initiated. |
|
Updated by |
Name of who did the last updating action, system, user, or AppSec team and so on. |
|
Updated by ID |
ID of who did the last updating action, system, user, or AppSec team and so on. |
|
Virtual hosts |
An array of asset identifiers includes all identifiers passed through the scan's vhost setting. |
|
Workflow ID |
Workflow ID number. |
|
Workflow name |
Scans belonging to a workflow display the workflow name. See Workflows article for more information. |
Related Articles
- Windows 10/Windows 2019 Server
- General Information about SMB/WinRM Scanning
- Windows 8.1
- Scan Blueprint
- How to Test SMB Authentication
- Docker Image Assessment
- Windows 2016 Server
- How to Scan AWS ECR Images
- Scanning-Less Scanning
- Scan Scheduling Errors
- Network Host Assessment
- Core Installation
- Windows 2008 R2 Server
- Scanning Range
- SMB Authentication from OUTSCAN/HIAB