Last Updated: 2024-03-08
Purpose
This article serves as a guide to the Delta view, offering insights into its functionalities, capabilities, and the visualization and data flow across different views.
Introduction
As a pivotal component in assessing the organization's cybersecurity posture, risk remediation, and exposure over time, the Delta view guide provides a holistic understanding of its functionalities, visualizations, and data interconnections within visible views. Delta shows you the change during a set time period such as how many findings remained unchanged, added or removed during set time. In the stair-step slide menu on the left hand side you can select specific Assets that you want to show the delta for.
Delta View
To access the Delta view, navigate to Insights > Delta in the Main Menu.
Layout
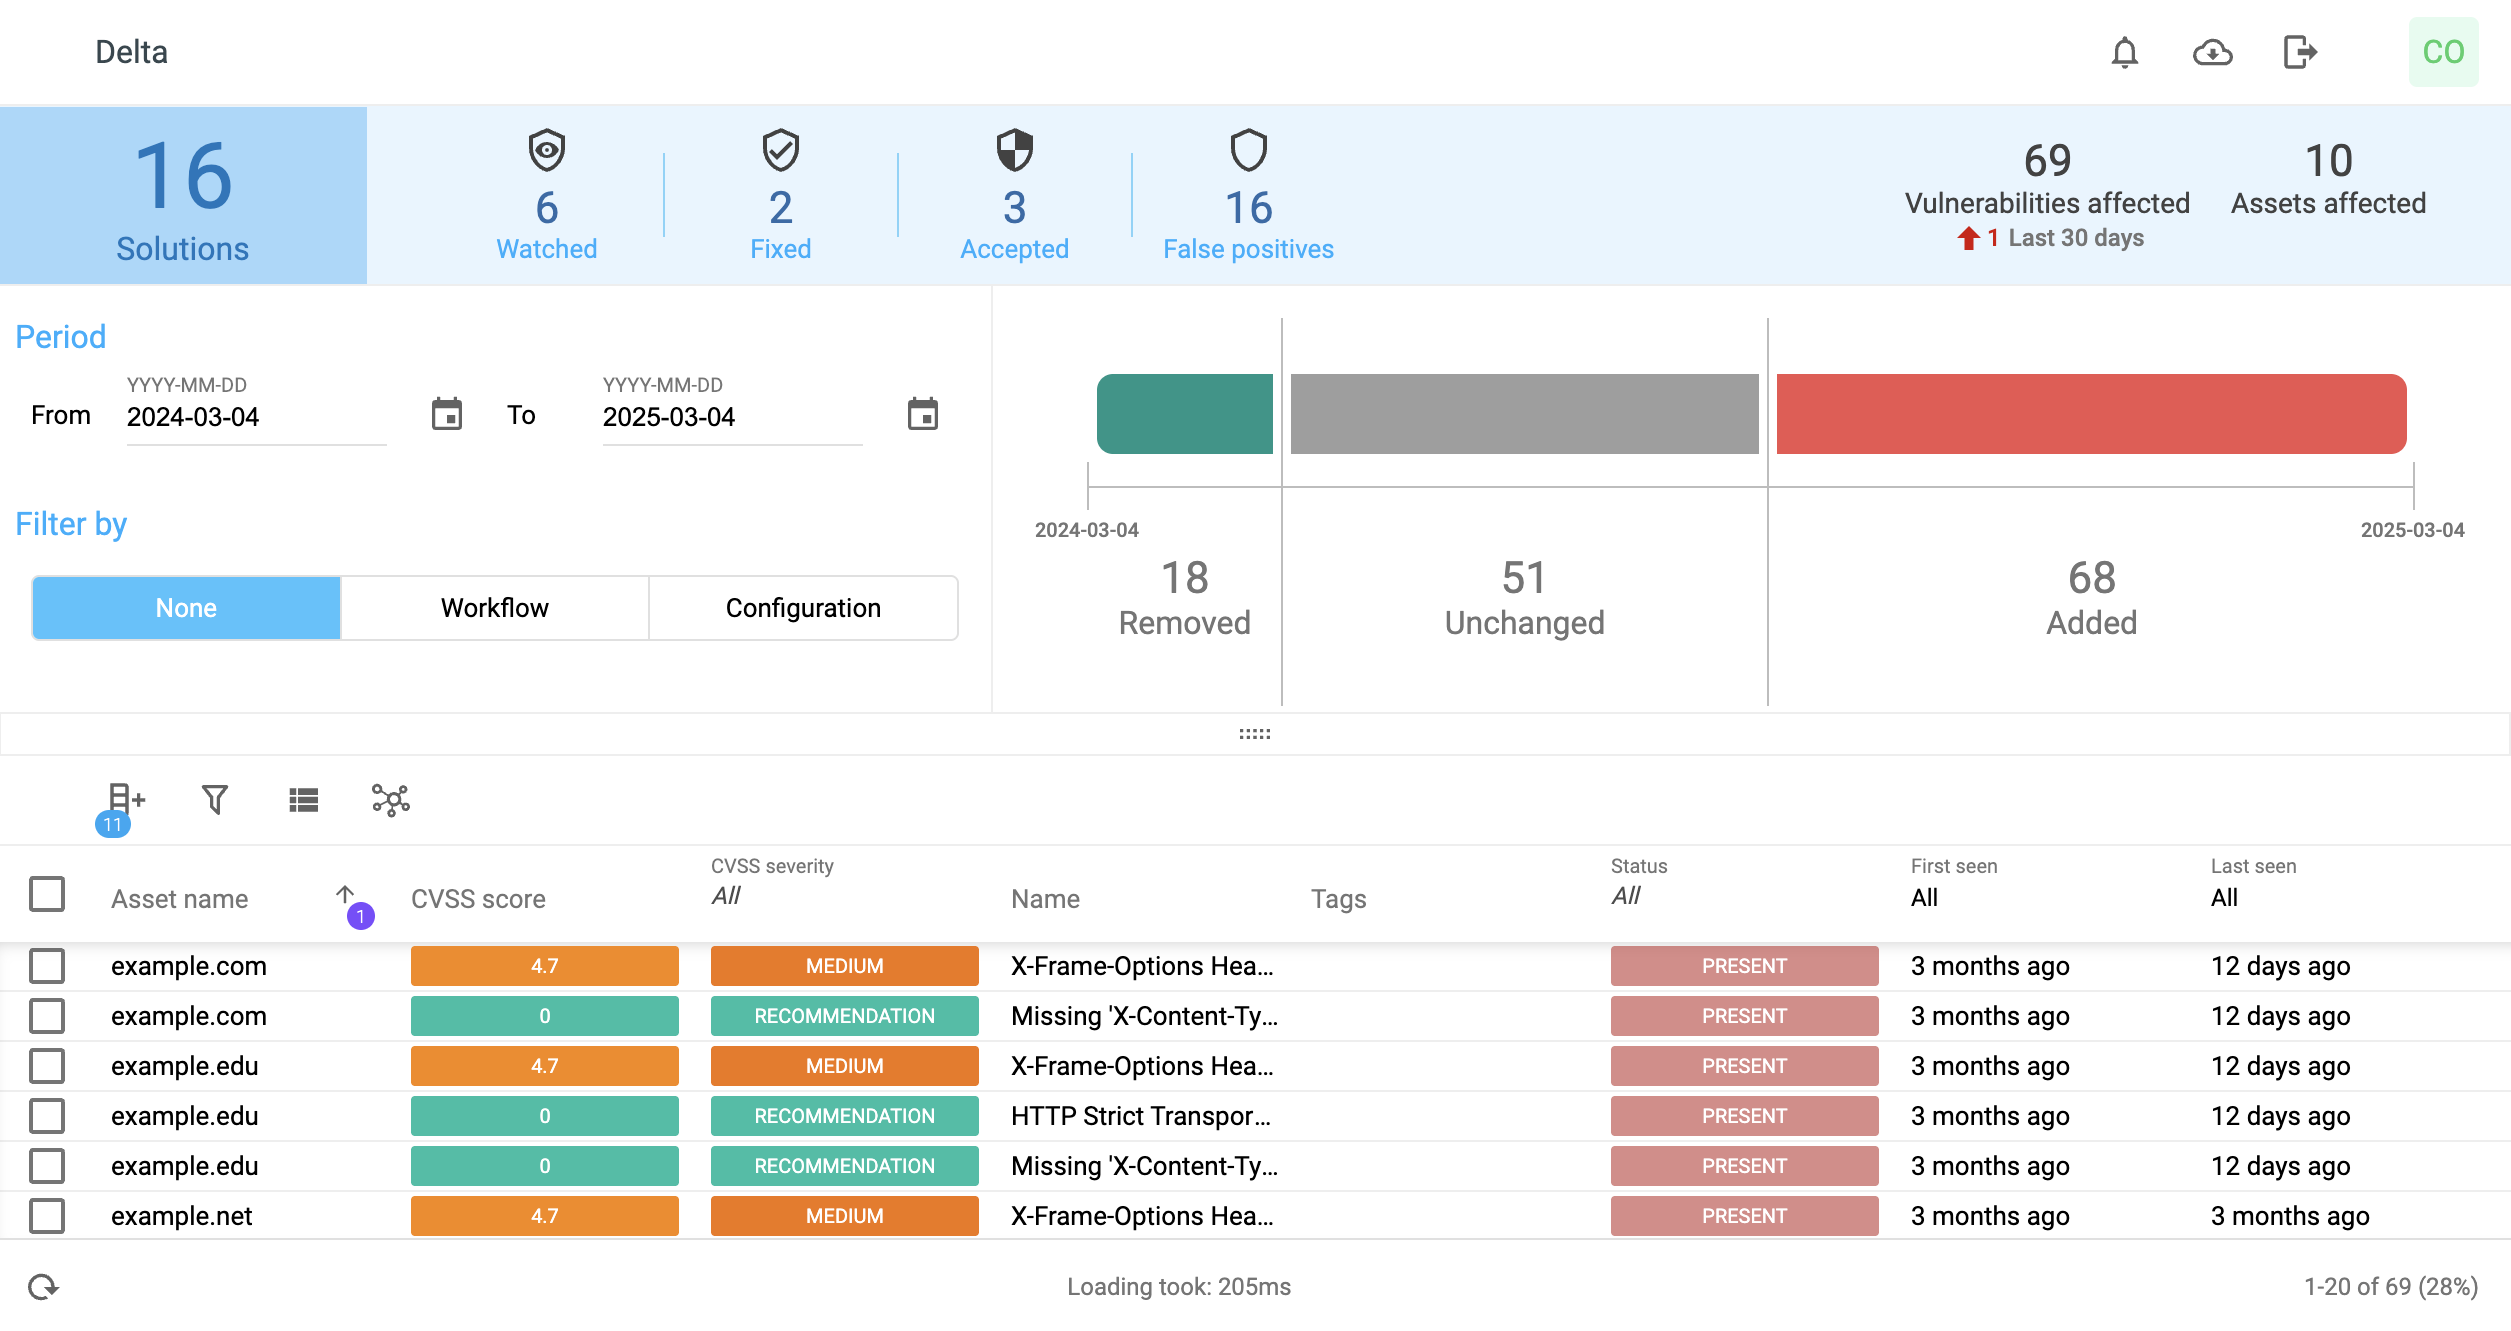
The Delta view is divided into four main parts. Solutions bar, date selection with optional filter by configuration or workflow, bar chart and vulnerabilities table.
Solutions bar
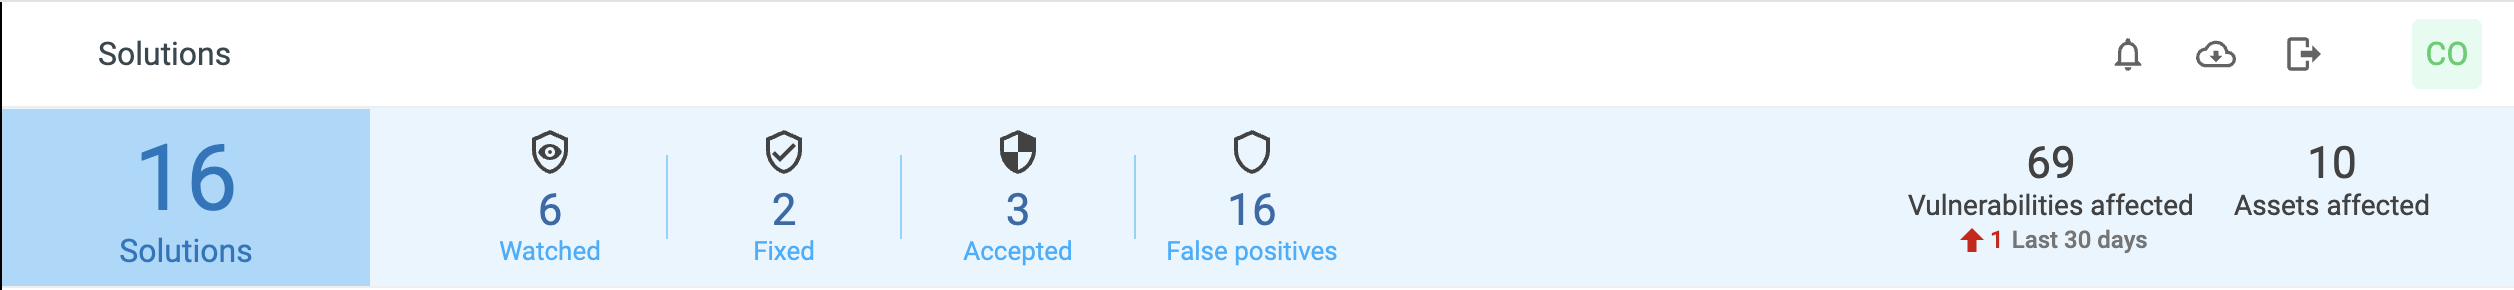
This top section shows:
-
Total number of solutions available for the data on screen
-
Watched - count of watched vulnerabilities
-
Fixed - count of fixed vulnerabilities
-
Accepted - count of accepted vulnerabilities
-
False Positives - count of vulnerabilities marked as false positives
On the right side, you will see:
-
Vulnerabilities count - Shows how many vulnerabilities are currently visible in the table, including any increase or decrease.
-
Assets affected - Shows how many assets are impacted. Only added assets are counted, removed ones are not.
The tiles for Watched, Fixed, Accepted, and False Positives are clickable. Clicking a tile filters the vulnerabilities table and updates all related metrics on screen.
Solutions bar chart
Below the bar, a chart shows all solutions grouped by type, ordered by count and representing first level of drill-down.
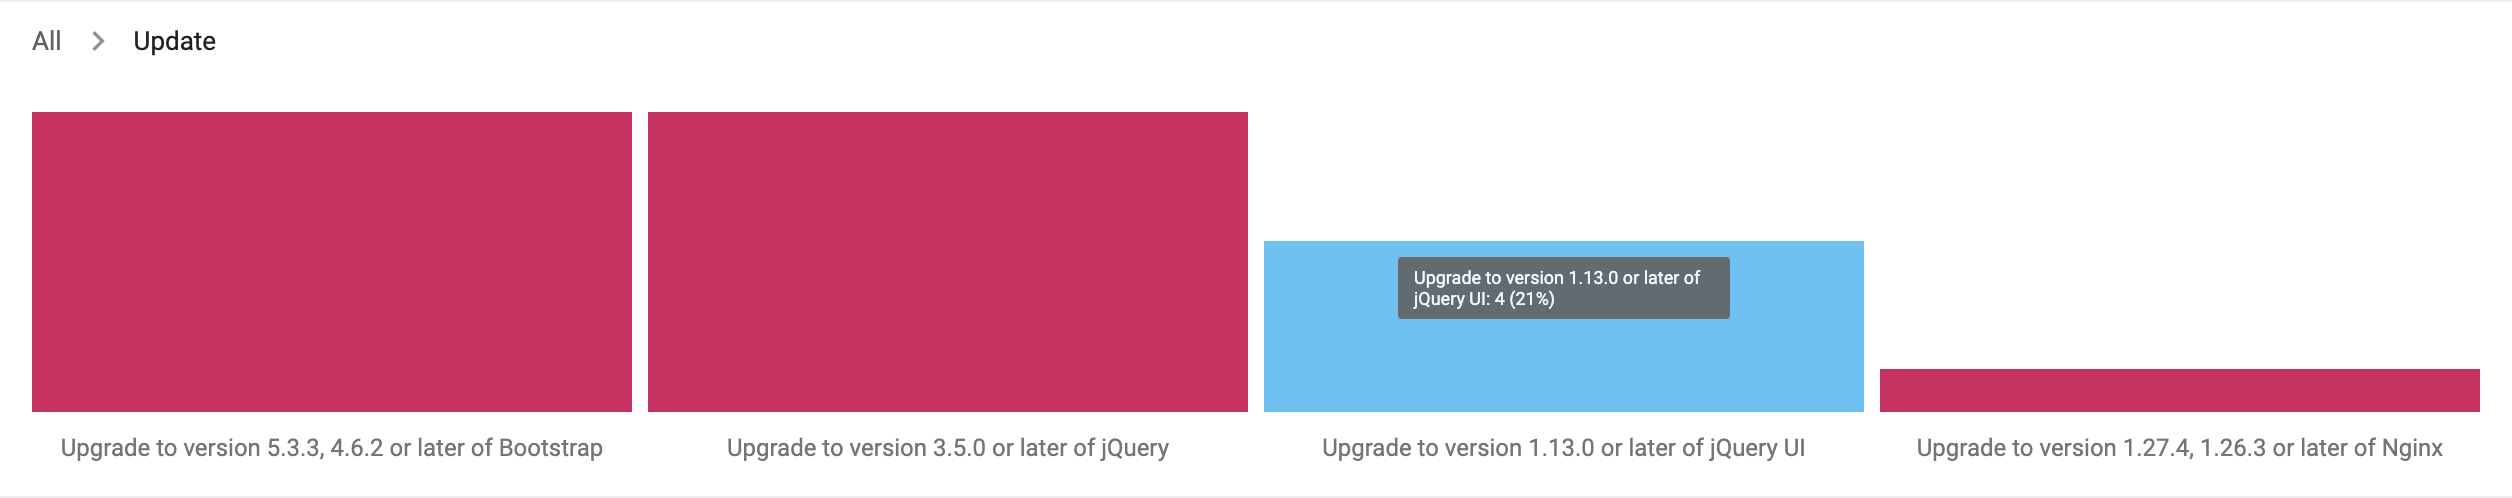
Click a bar solution type bar to see the specific solutions. Click a solution to filter by it. Any interaction in this chart filters all visible data in the vulnerabilities table and metrics. Likewise, filters applied in the vulnerabilities table also affect the displayed metrics and stats.
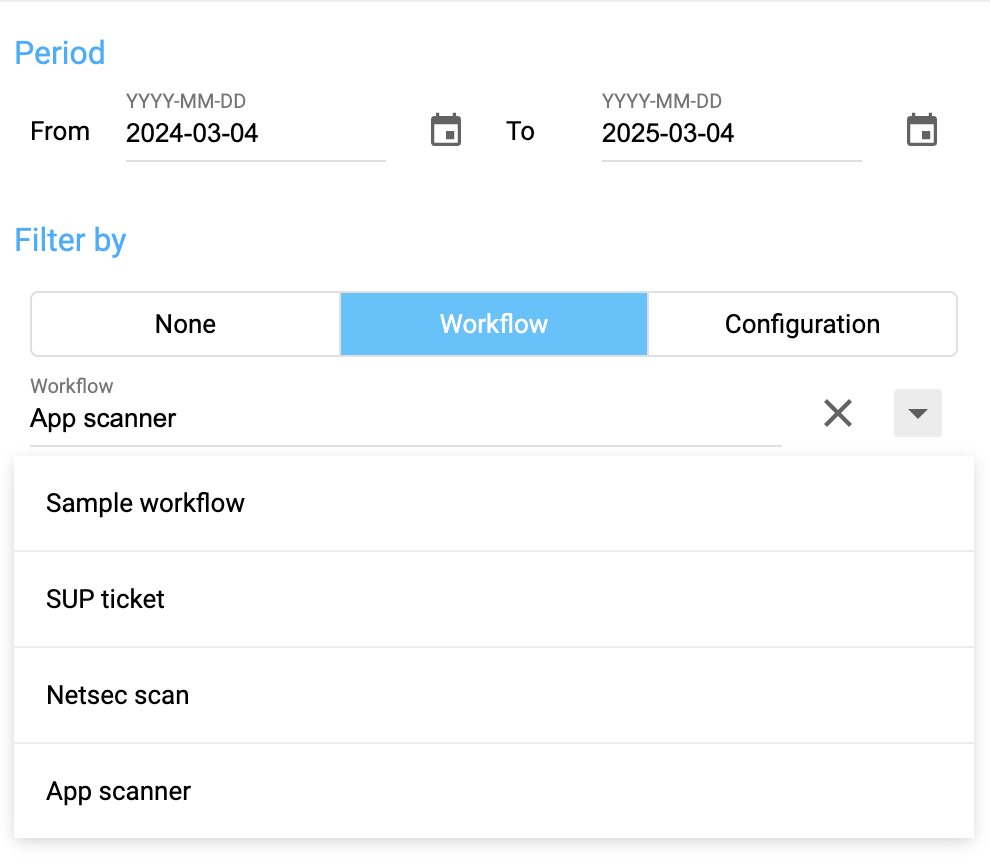
Period, workflow and configuration filter
Period is required and can be set to any date range. By default, it shows data from today going one year back.
You can also filter by configuration or workflow (optional). These filters help narrow the results to a specific subset of vulnerabilities found using these configurations.
Delta Visualization
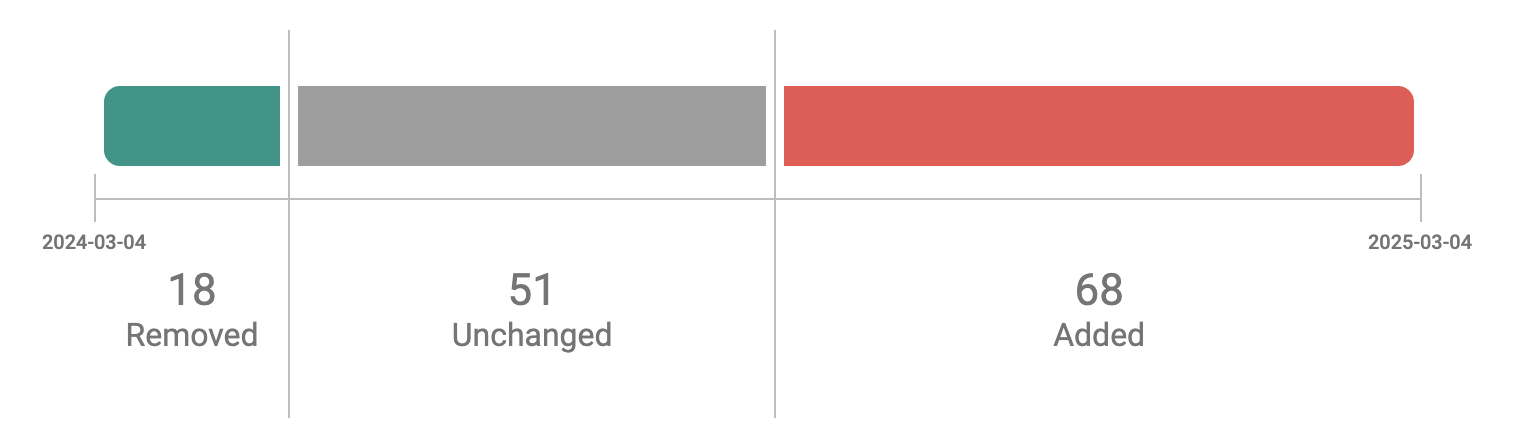
The delta visualization incorporates a horizontal bar chart with three categories:
-
Unchanged: Represents the number of findings that existed before the start of the selected time period and are still present after the end of the period. Clicking this bar applies a filter showing findings that meet these criteria (For example, "First seen <= start date" and "Last seen >= end date")
Technical criteria: First seen on or before the start date, and last seen on or after the end date. -
Added: Represents the number of findings that were first detected during the selected time period. These are new vulnerabilities that appeared within the timeframe and are present at the end. Clicking this bar applies a filter showing findings that were first seen during the period (For example, "First seen >= start date").
Technical criteria: First seen on or after the start date (and typically up to the end date). -
Removed: Represents the number of findings that were last detected during the selected time period, meaning they were present earlier but no longer appear after the end date (e.g., due to resolution or fixes). These are vulnerabilities or issues that disappeared within the timeframe. Clicking this bar applies a filter showing findings last seen during the period (For example, "Last seen between start and end dates"), which highlights what was removed - not findings absent throughout the period.
Technical criteria: Last seen on or after the start date and on or before the end date.
For accurate "Removed" counts, scans must have run at least once on all relevant assets after the end date to confirm the findings are truly gone. Without this, recent data may not fully reflect removals.
The chart is fully interactive and will apply filter to the whole view and update any visible counters and stats.
Vulnerabilities Table
For a detailed understanding of how the Vulnerabilities view operates, refer to Vulnerabilities for an overview.
Reference
Related Articles