CORE Dashboard
Purpose
This document explains the various parts and functions of the CORE Dashboard.
Introduction
The CORE is an analytics platform designed to look at NetSec and AppSec assets in a single place and identify risk based on Farsight data. The data is displayed on a common view where data can be penetrated further by clicking on the various card presented on the dashboard.
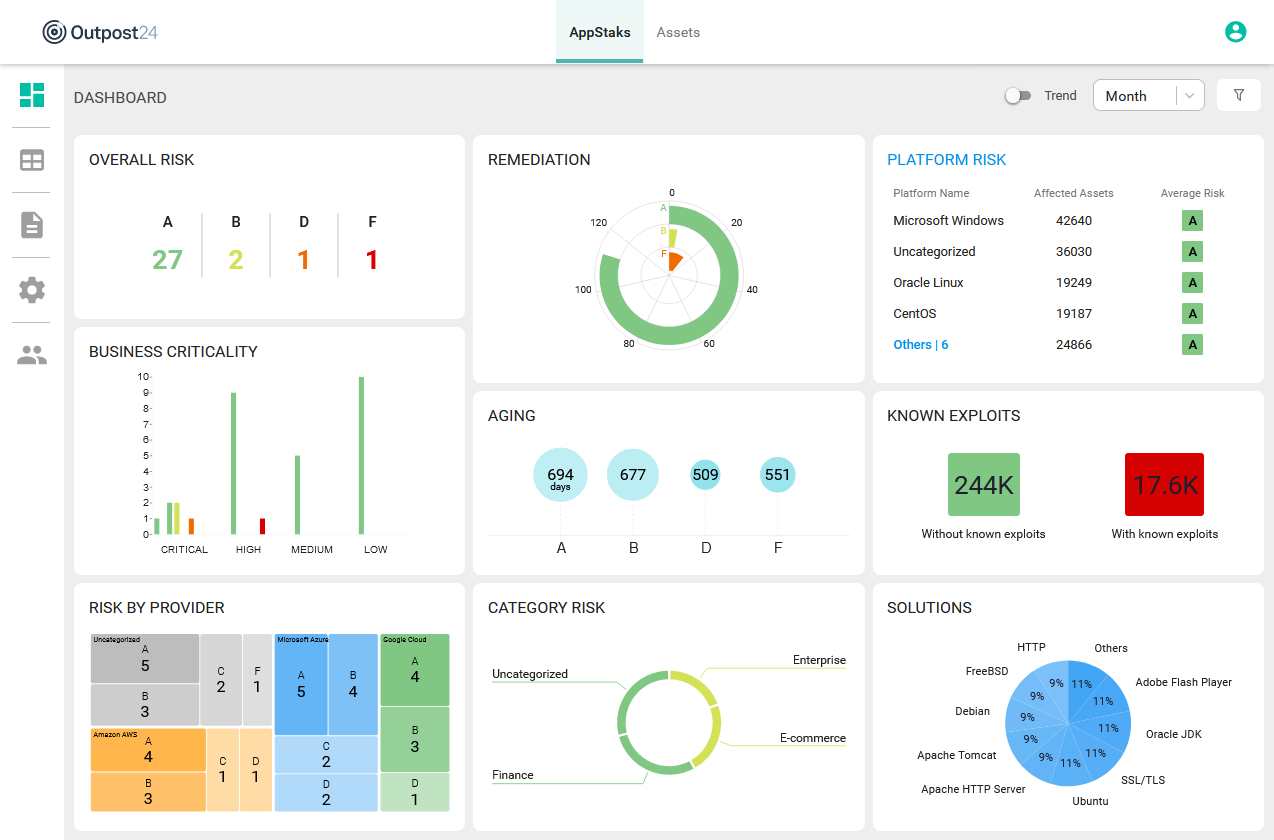
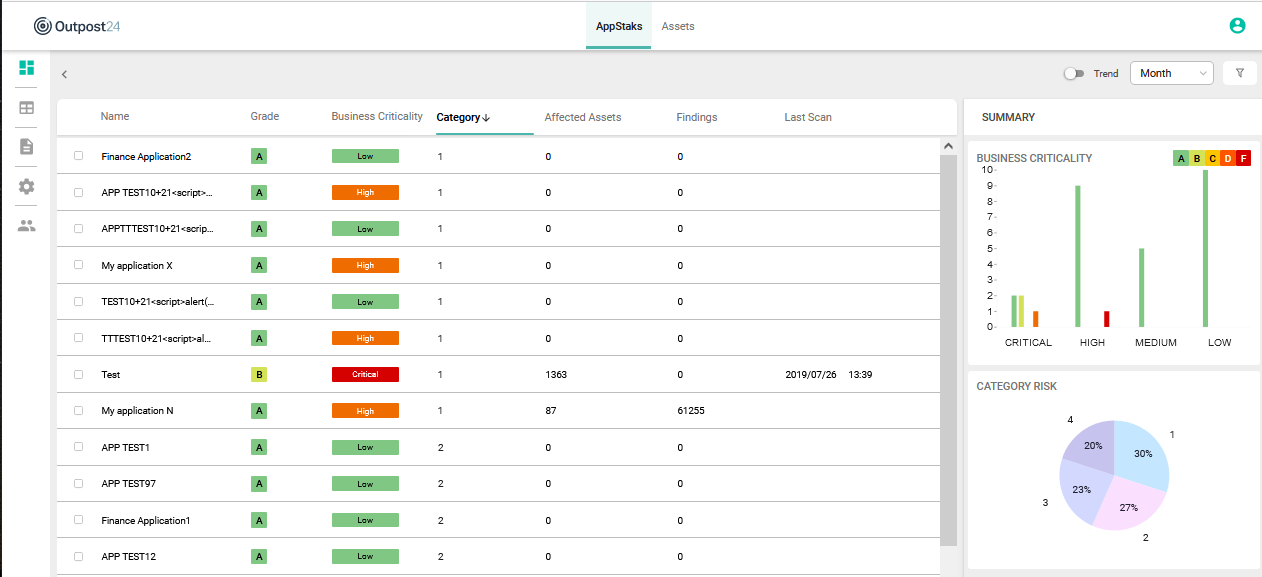
Dashboard
The Dashboard consists of several cards that describes various views of the findings.
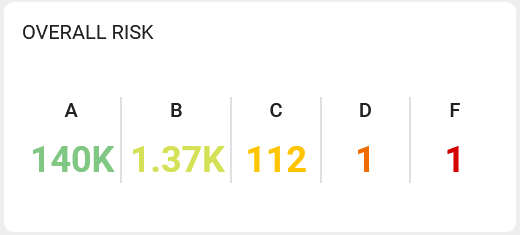
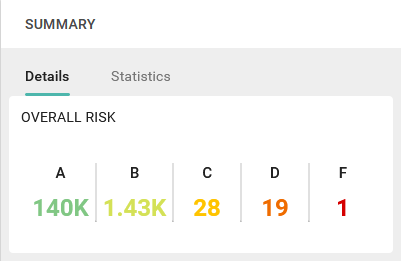
Overall Risk
The Overall Risk card provides a quick overview of the risk grades on a scale from A to F where F represents the most critical risks. Clicking the risk grade displays a table filtered on the level clicked.
How are Grades Calculated
To calculate the risk value of a finding, the following metrics are used and evaluated in the following order:
- Likelihood (Farsight)
- CVSSv3
- CVSSv2
This order works as a funnel, for example if the likelihood is not present, the CVSSv3 will be used, if there is no CVSSv3, CVSSv2 will be evaluated and so on.
An Asset's risk is comprised of:
Business criticality (priority)
Exposure
The single highest finding (weakest link) on the asset
Asset risk is calculated as an average of the risk score of the associated with the AppStak assets.
Only findings that has the status PRESENT are included when calculating the grades for Assets, Asset Groups, and AppStaks.
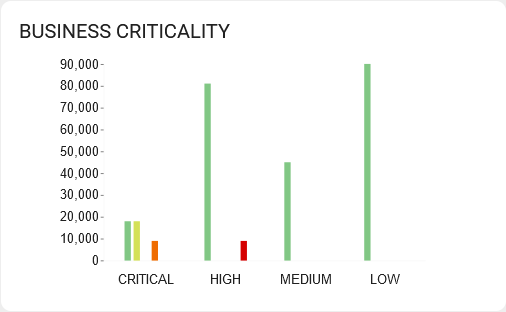
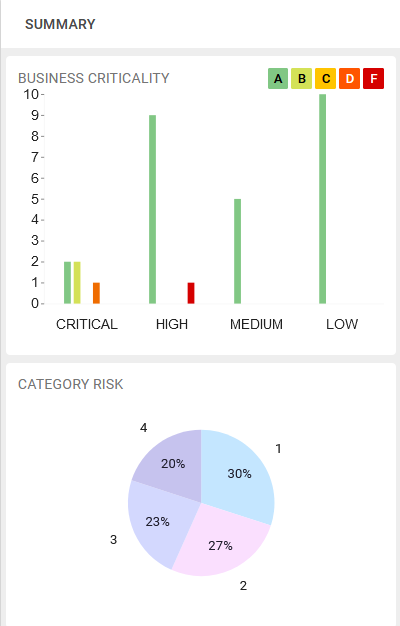
Business Criticality
Business criticality defines the customer's view of how much risk is associated with a specific Asset should it be compromised by a threat actor. For example, an E-commerce database storing customers payment details could be considered critical from a risk perspective.
This card shows distribution of risks A-F over business criticality. Clicking the bars in the chart displays a table filtered on the bar clicked. Business criticality is an attribute that is managed in Netsec in the Manage Targets section.
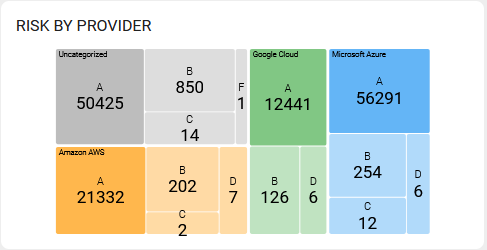
Risk by Provider
The Risk by Provider card shows you the groupings of different cloud providers within the AppStaks and Assets. Each group shows the amount of findings in the A-F scale as described in Overall Risk. Clicking on them brings you to the asset view filtered with that cloud provider group and the risk level.
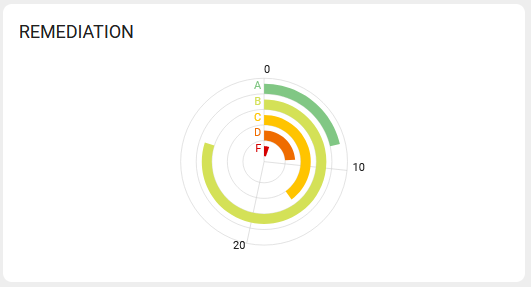
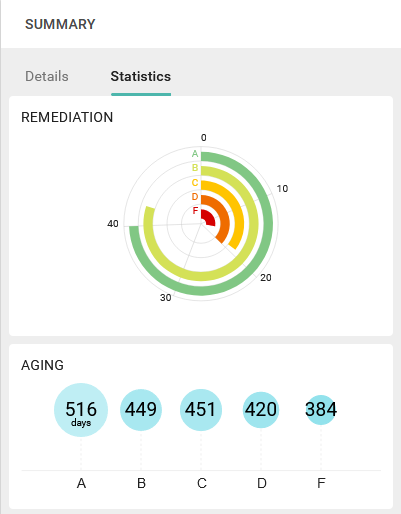
Remediation
Remediation is an average of days between the first day a finding was detected and the last day for all findings belonging to an asset.
Clicking the bars in the chart displays a findings table filtered on the bar clicked.
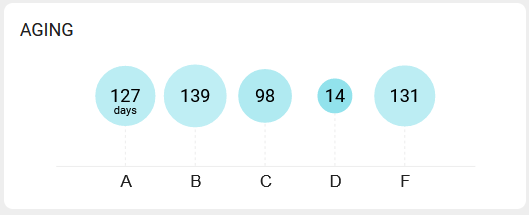
Aging
The Aging card shows the average time past from the first occurrence of the finding in each risk grade from your scans. Clicking on a specific circle displays a table filtered to present the list of a the chosen grade. Depending on which view is selected, AppStaks or Assets, the respective table shown.
Category Risk
The Category Risk card shows you the groupings of different AppStaks or Assets depending on which tab that are active .
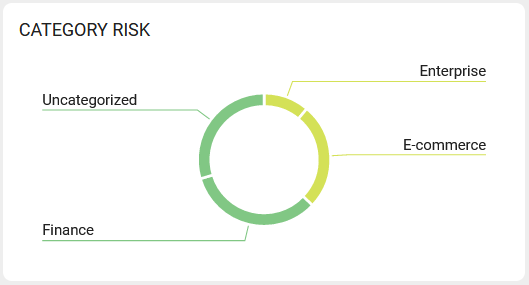
Clicking on each of the segments in the ring presents an in depth view of the risks of the assets in that specific category in a table filtered on the segment clicked.
For information on how to manage categories, see CORE Configure Categories.
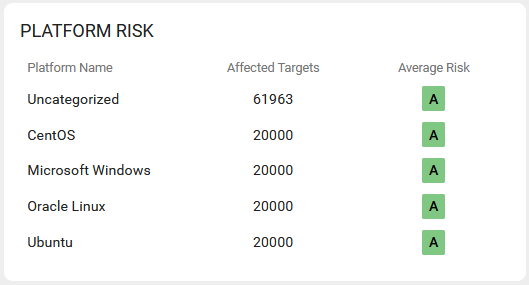
Platform Risk
The Platform Risk card shows you the groupings of different platforms and their average risk within the findings.
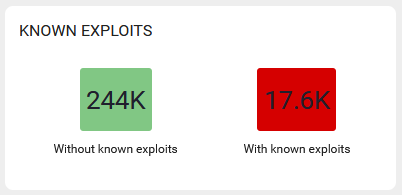
Known Exploits
The card represents a count of findings which have been found and confirmed to be exploitable. The Non-exploitable count represents the amount of findings which at the present time have not been confirmed as exploitable.
Clicking on any of the numbers presents a filtered table with items either having or not having exploitable findings in them.
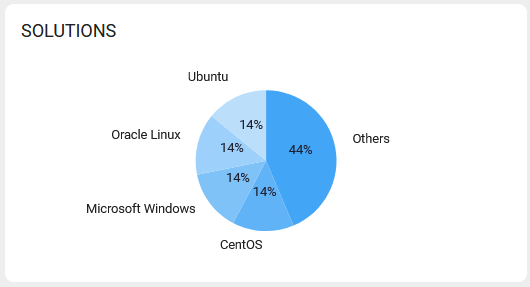
Solutions
The Solutions card applies to both AppStaks and Assets, and shows you the groupings of different platforms within the findings, and helps you quickly focus on where the best effort should go to remedy any vulnerabilities on various platforms.
Summary Filters
Several of the cards provides filter when drilling down in the results.
AppStaks View Filter
Clicking on the card headings takes you to the table view where you can see the result on all of your AppStaks.
By clicking on the columns in the Business Criticality diagram or on the Category Risk pie chart under Summary, you can filter the findings to your choice.
Assets View Filter
Clicking on the card headings while in the Assets tab takes you to the table view where you can see the result on all of your assets.
In the Assets View the Summary consists of two tabs, Details and Statistics.
The Details tab use the same OVERALL RISK card as the Dashboard and allows you to filter on each of the risks shown.
The Statistics tab use the Remediation card and the Aging card which both allow you to filter the result by clicking on their content.
Trends
Trend views shows how business risks are developing over time, displaying if they are improving or getting worse and the causes of them.
Trends are applied to AppStaks, Assets, and Findings.

Displaying Trends
The Dashboard can be toggled into displaying the result of the scanning in trends by switching the Trends button in the upper right corner.
The drop down menu to the right of the trend toggle switch allows you to set the time duration of the trends shown in the dashboard.
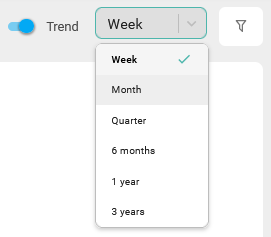
The various time frames are composed of smaller increments as shown in the table.
| Time frame | Consists of: |
|---|---|
| 1 Week | 7x Days |
| 1 Month | 4x Weeks |
| 1 Quarter | 3x Months |
| 6 Months | 6x Months |
| 1 Year | 4x Quarter |
| 3 Years | 6x 6 Months |
Related Articles
Copyright
© 2024 Outpost24® All rights reserved. This document may only be redistributed unedited and unaltered. This document may be cited and referenced only if clearly crediting Outpost24® and this document as the source. Any other reproduction and redistribution in print or electronically is strictly prohibited without explicit permission.
Trademark
Outpost24® and OUTSCAN™ are trademarks of Outpost24® and its affiliated companies. All other brand names, product names or trademarks belong to their respective owners.