CORE Trends
Purpose
This document gives a brief overview of CORE Trends.
Introduction
Trend views shows how business risks are developing over time, displaying if they are improving or getting worse and the causes of them.
The trend dashboard consists of a number of cards. Each card has an information tooltip that briefly explains the content of the card.
Hovering over the graphs show a tooltip with more detailed information about the data presented.
Trends are applied to AppStaks, Assets, and Findings.
Displaying Trends
The Dashboard can be changed into displaying the result of the scanning in trends by changing the Time span drop down menu in the upper right corner from "Now" to the wanted time span.
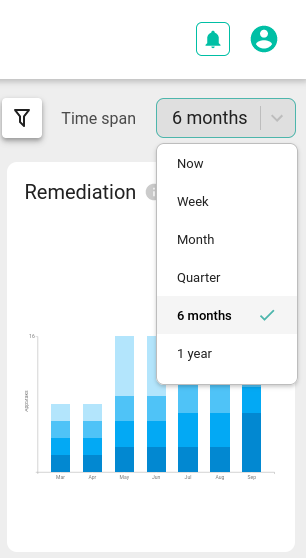
The various time frames are composed of smaller increments as shown in the table.
| Time frame | Consists of |
|---|---|
| 1 Week | 7x Days |
| 1 Month | 4x Weeks |
| 1 Quarter | 3x Months |
| 6 Months | 6x Months |
| 1 Year | 4x Quarter |
| 3 Years* | 6x 6 Months |
*) Some cards like Average risk, Appstaks and Assets will not show values when you have selected 3 Years as they look at the next higher resolution.
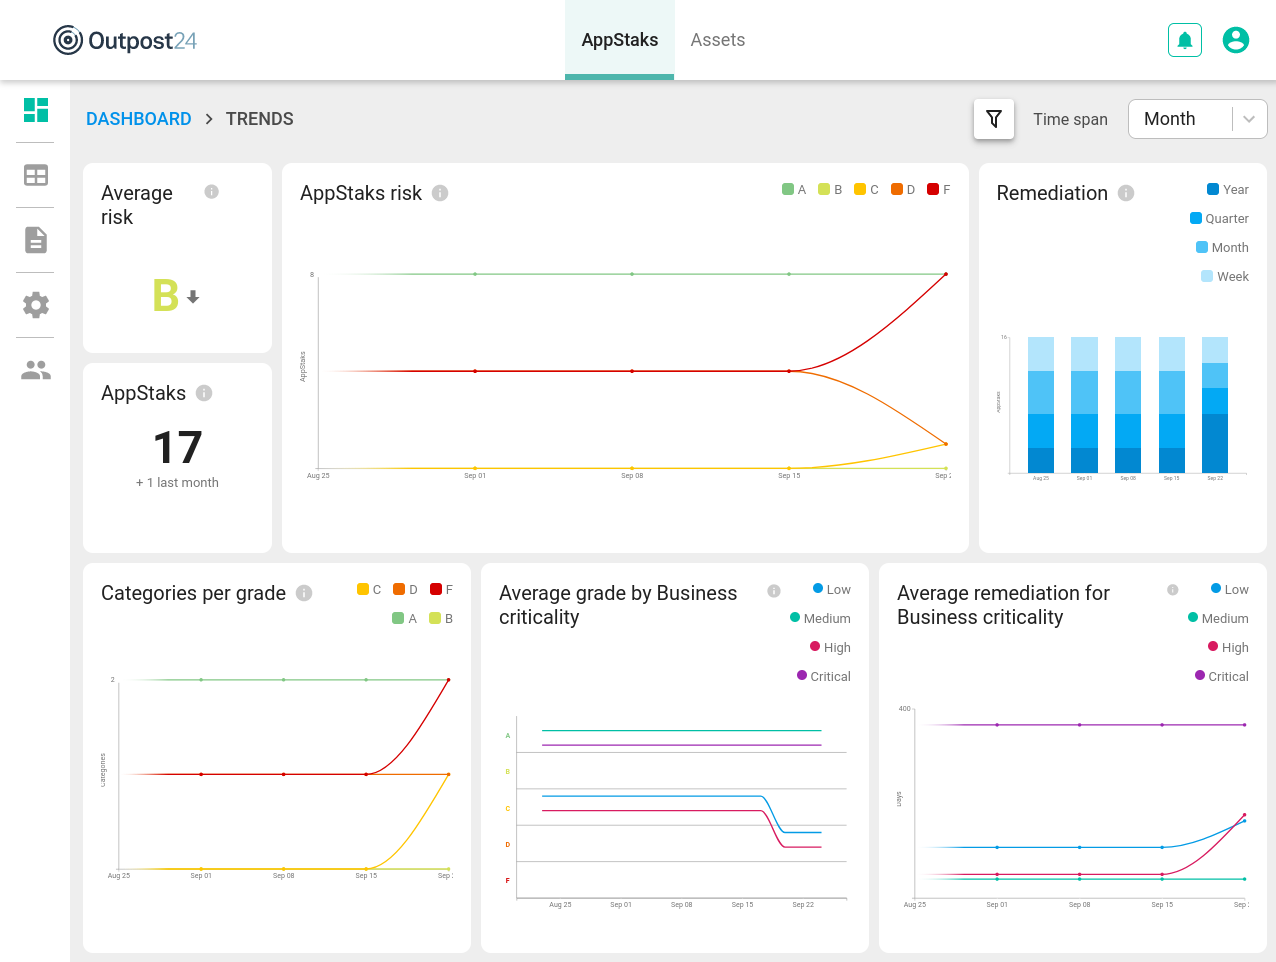
AppStaks Dashboard
The AppStaks dashboard shows trend over time from an AppStak perspective.
Average Risk
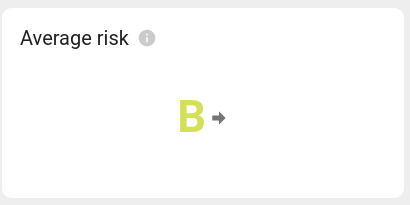
The Average risk card provides a quick overview of the average risk grade for all AppStaks as well as the change since last month. The grades are shown on a scale from A to F where F represents the most critical risks. The arrow indicates the change in risk since last time by either pointing up, to the right or down.
When selecting the timeline for the dashboard, this card show the difference between the current data and the value from the previous time interval as shown in the timeline drop down.
Selecting Month in the timeline drop down means that the value is compared with the value since last month.
AppStaks

The AppStaks card shows the current number of AppStaks as well as the change since previous period.
When selecting the timeline for the dashboard, this card will show the difference between the current data and the value from the previous time interval as shown in the timeline drop down.
Example
Selecting Month in the timeline drop down means that the value is compared with the value since last month.
For more information about AppStaks, see CORE AppStaks.
AppStaks Risk
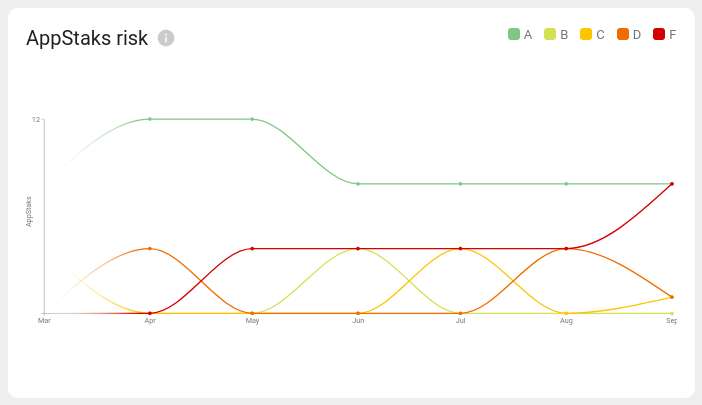
The AppStaks risk card shows the number of AppStaks for each of the grades and how that has changed over time.
The horizontal axis shows the time and the vertical axis shows the number of AppStaks for each of the grades.
When an AppStak changes its grade from one period to the next, the curve of the previous grade goes down one step and the curve of the new value goes up one step.
Remediation

The Remediation card shows what the average remediation time for AppStaks has been for each time interval. It show the number of AppStaks with remediation time of more than one week, one month one quarter and one year.
The height of the bars shows the number of AppStaks, excluding those that have a remediation value under one week. For the other remediation values the height of each segment shows the number of AppStaks.
The remediation value for an AppStak is calculated as the average remediation for each finding in the AppStak.
Categories per Grade
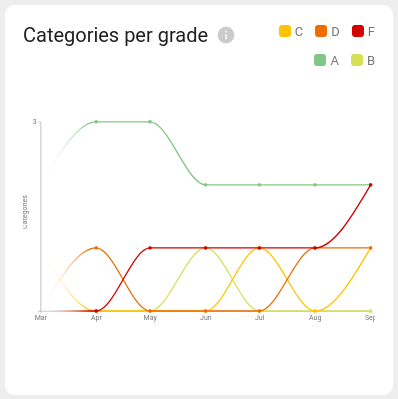
The Categories per grade card shows the number of categories for each grade and how that has changed over time. This is similar to the AppStaks risk card but for categories.
Average Grade by Business Criticality
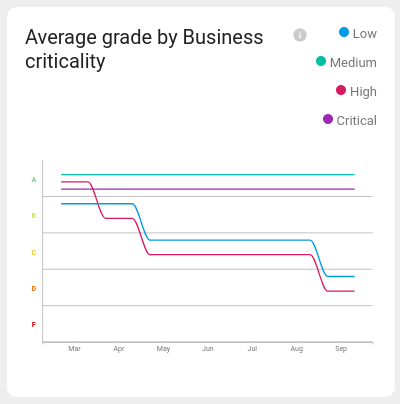
The Average grade by Business criticality card groups AppStaks together based on business criticality and shows the average grade per business criticality value.
Average Remediation for Business Criticality
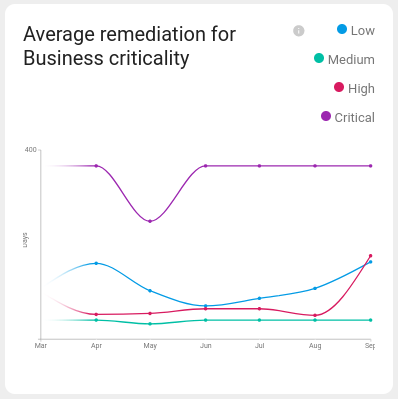
The Average remediation for Business criticality card show the average time between a finding is first seen and last seen, indicating how fast vulnerabilities are fixed. The remediation times are shown as averages for each AppStak business criticality.
Assets Dashboard
The Assets dashboard shows trend over time from an asset perspective
Average Risk
The Average risk card provides a quick overview of the average risk grade for all assets as well as the change since last month. The grades are shown on a scale from A to F where F represents the most critical risks.
Assets
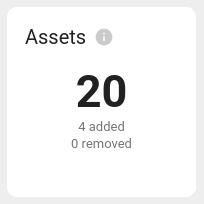
The Assets card shows the current number of assets as well as the change since previous period.
For more information about Assets, see CORE Assets.
Assets Risk

The Assets risk card shows the number of assets for each of the grades and how that has changed over time.
Average Remediation
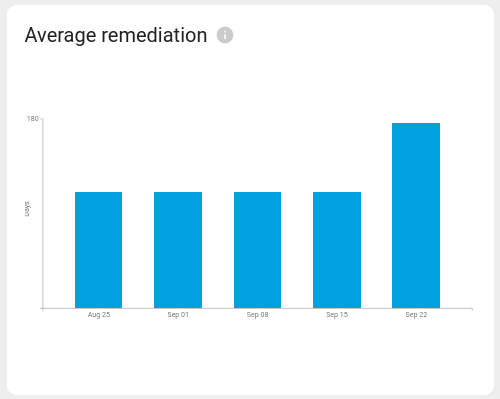
The Average remediation card shows what the average remediation time for assets has been for each time interval.
Average grade by Business criticality
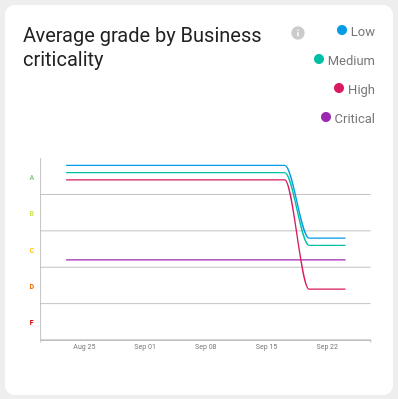
The Average grade by Business criticality card groups assets together based on business criticality and shows the average grade per business criticality value.
Known Exploits
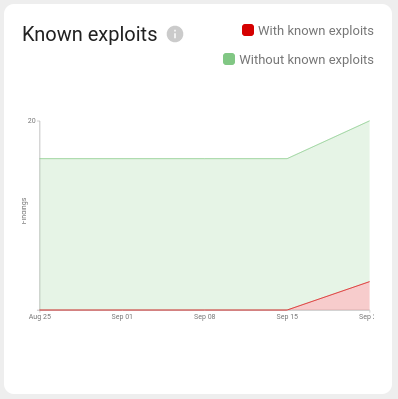
The Known exploits card shows the number of findings over time. The graph also shows how many of the findings have a known exploit.
Findings Delta
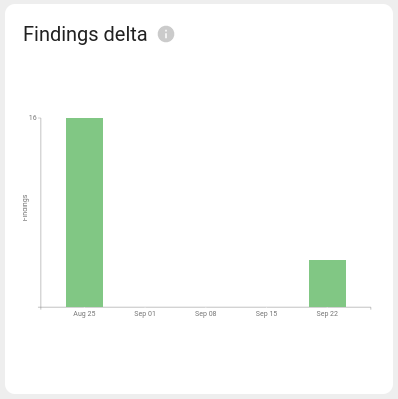
The Findings delta shows the number of findings that have been added and removed for each time period.
For more information about Findings, see CORE Findings.
Related Articles
Copyright
© 2024 Outpost24® All rights reserved. This document may only be redistributed unedited and unaltered. This document may be cited and referenced only if clearly crediting Outpost24® and this document as the source. Any other reproduction and redistribution in print or electronically is strictly prohibited without explicit permission.
Trademark
Outpost24® and OUTSCAN™ are trademarks of Outpost24® and its affiliated companies. All other brand names, product names or trademarks belong to their respective owners.