Purpose
This document provides users with an overview of the Reporting Tools for OUTSCAN and HIAB.
Introduction
After scanning your environment, Vulnerability Reports can be exported for one or more assets. The Netsec Reporting Tools for OUTSCAN and HIAB gather all the findings and lets you export them.
Requirements
This document has been elaborated under the assumption that the reader has access to the OUTSCAN/HIAB account and a Netsec subscription.
To access the Reporting Tools module, go to
Main Menu > Netsec > Reporting Tools.
Elements of Reporting Tools
(Portal Interface - Reporting Tools)
The Reporting Tools portal interface is made up of several elements arranged in different blocks, which help in building informational and customized reports.
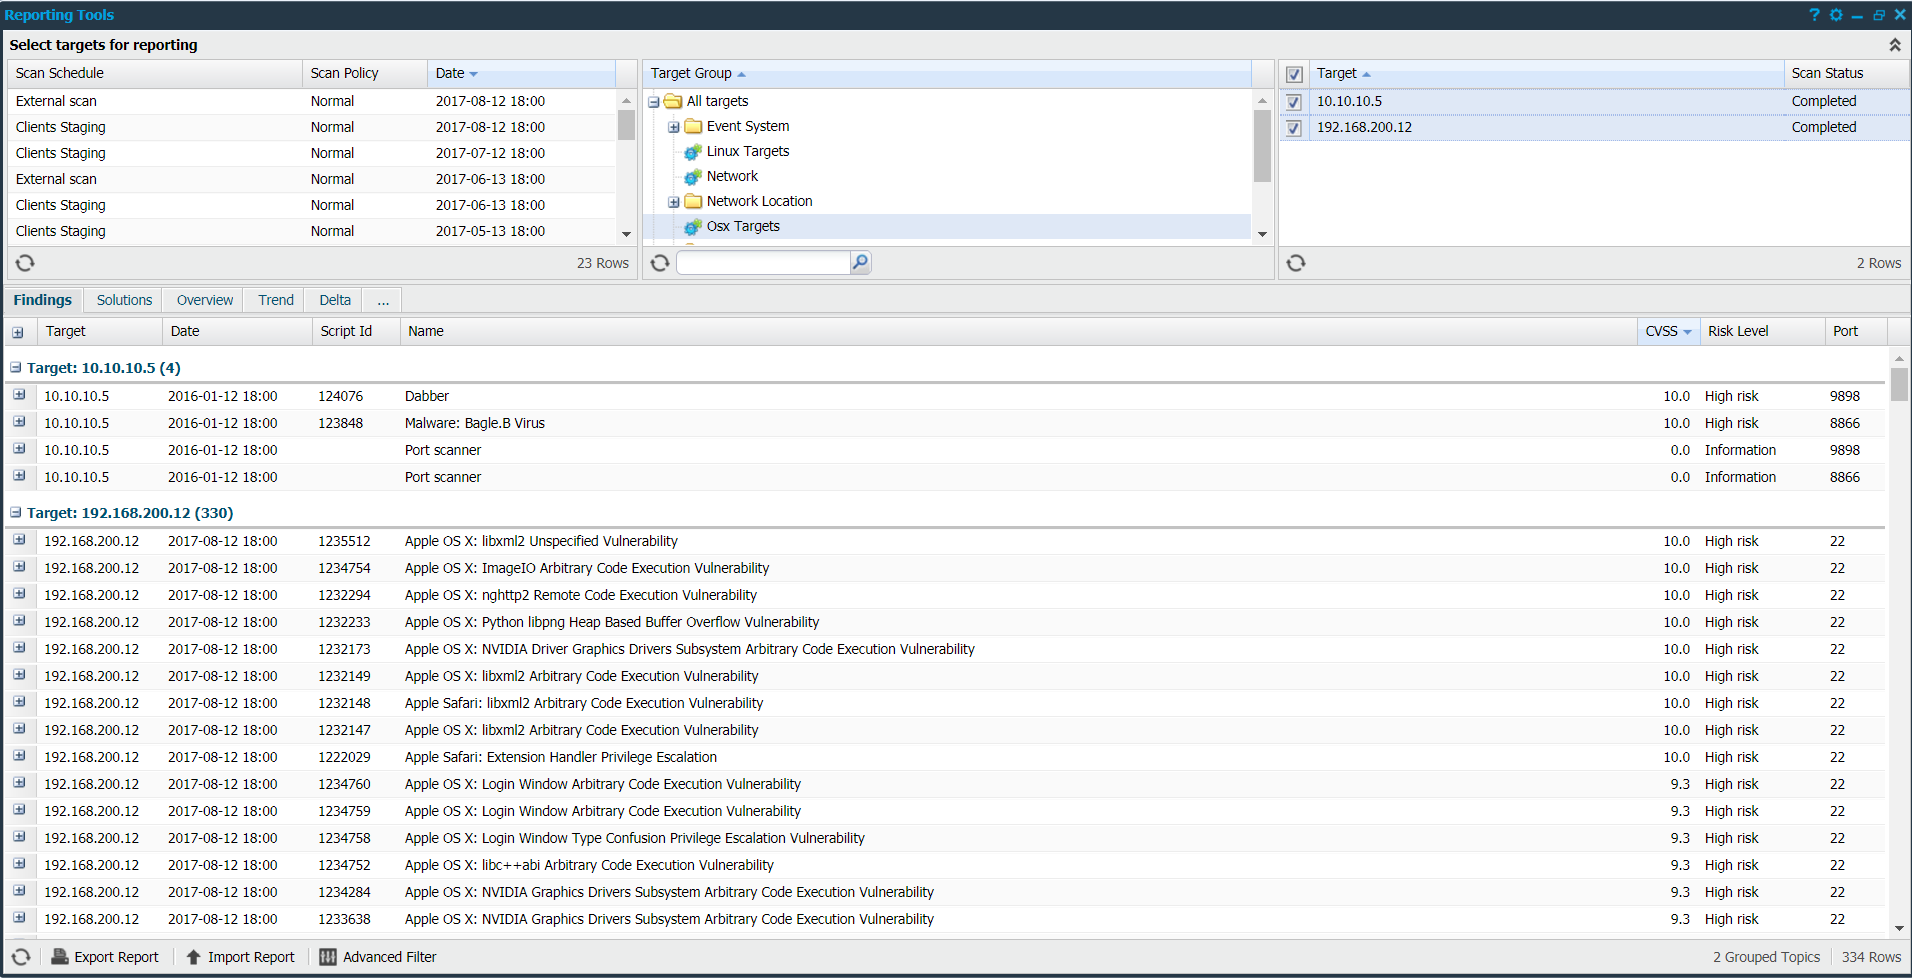
Each grid consists of several different columns. To enable or disable a column, click the arrow next to any column name and select columns in the drop-down menu.
Selecting Report Contents
The Select targets for reporting grid allow you to select targets for which the report content is displayed in the bottom grid. It is important to identify the correct scan schedule for generating a report.
Report Template Grid
The Report Template grid is used to filter the targets by defined templates and is visible only if there are any saved templates.
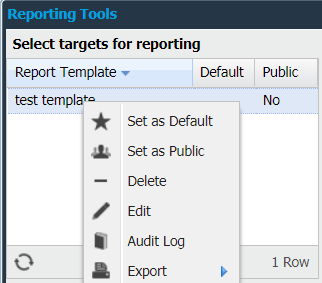
A template is a saved setup which includes targets, target groups, scan schedules, filters, grouping, and columns. This setup is applied to the Findings tab when a template is selected.
Creating a report template is done by right-clicking on any finding in the finding grid and choosing Save Report Template.
To change the status of a template, right-click on the entry and select Set as Default.
To clear the status, click on Clear Default. If a template is marked as default, its settings are applied by default whenever the reporting section is opened.
Templates which is Set as Public are available for all users. If Set as Private, the template is protected from all users and viewed only by the user who created it.
If the filters do not provide any entries, click on any field (column name) and create a template from there.
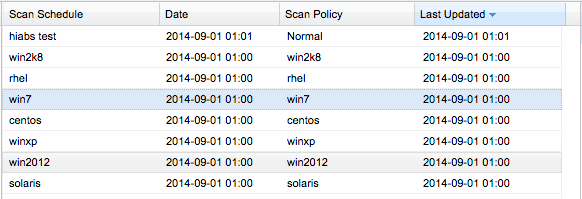
Scan Schedule Grid
The Scan Schedule grid allows you to select a specific scan schedule that has been executed. If the scan schedule has been executed multiple times, you can select any specific scan target to examine the details. To deselect a scan target, re-click on the selected entry.
The visible columns are:
|
Option |
Description |
|---|---|
|
Scan Schedule |
The name of the scan schedule that was executed. |
|
Scan Policy |
The name of the scan policy that was used for that scan. |
|
Date |
The start date and time of the scan. |
|
Last Update |
The last time this report was updated using the Scanning Less Scanning (SLS) feature. |
Additional functions in the Scan Schedule grid:
|
Option |
Description |
|---|---|
|
Show Delta |
Right-click and select Show Delta. This action opens the Delta tab. |
|
Scan |
Right-click and select Scan to initiate a scan immediately. |
|
Update Scan Results |
Right-click and select Update Scan Results to execute a SLS against the targets selected. This option is not available if the scan is older than a month.
|
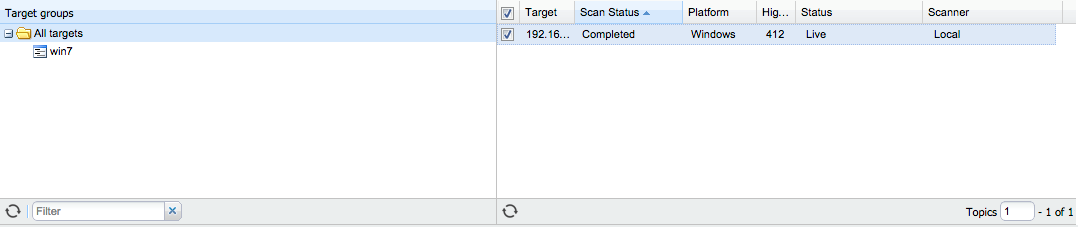
Target Groups
The targets section allows you to select a specific or a group of targets. It is further divided into Target groups and Targets.
It is used to select group(s) to display in the Targets grid.898
To select multiple Target Groups, press and hold Shift or Ctrl while choosing multiple items in the target group tree.
Filter allows to categorize the target groups based on name. Enter a portion of the desired target name and the tree is filtered to show only the target groups that match the entered string.
Targets
It displays the targets contained in either the selected schedule or targets groups. It allows you to determine which targets should be included in the report. At least one target must be selected to generate a report.
Additional functions from the target column:
|
Option |
Description |
|---|---|
|
Delete Report: |
Right-click and select Delete Report. This action deletes the entire report, even if the report is filtered based on some criteria. It cannot be reverted. To delete a report, the user role must have necessary privileges.
|
|
Export |
Exports currently visible data as HTML or CSV. |
|
Update Scan Results |
Execute a Scanning Less Scan against the targets selected. This option is not available if the scan is older than a month. |
|
Scan |
Starts a scan against the selected targets in the Target Grid. Only available if the Force target groups in scan scheduling option is disabled. To disable this, go to scan scheduling, click on the settings icon located on upper right corner of the window.
|
|
Grant Support
|
This option allows you to define a time window during which the support team can view your report. No alert is sent to the team by default. You must notify them once the task is performed.
|
The Target grid is configurable and includes the following columns:
|
Option |
Description |
|---|---|
|
High Risk |
The number of high risks detected on a specific target. |
|
Host Name |
Host name of the target. |
|
Instance ID |
The Amazon Web Services (AWS) instance ID of the target. |
|
Low Risk |
Number of low risks detected on a specific target. |
|
Medium Risk |
Number of medium risks detected on a specific target. |
|
NetBIOS
|
The NetBIOS name of the target. |
|
Platform |
Detected platform of the target. |
|
Scan Status |
Displays how the scan ended. For any vulnerabilities to be present in the reporting grid, the scan status should state Completed. |
|
Scanner
|
Displays which scanner the scan was executed on. Only visible if at least one scanner is already registered. |
|
Status |
Shows if target was alive or not reachable during the scan. |
|
Target |
Shows IP address/hostname/NetBIOS of the target. |
Findings
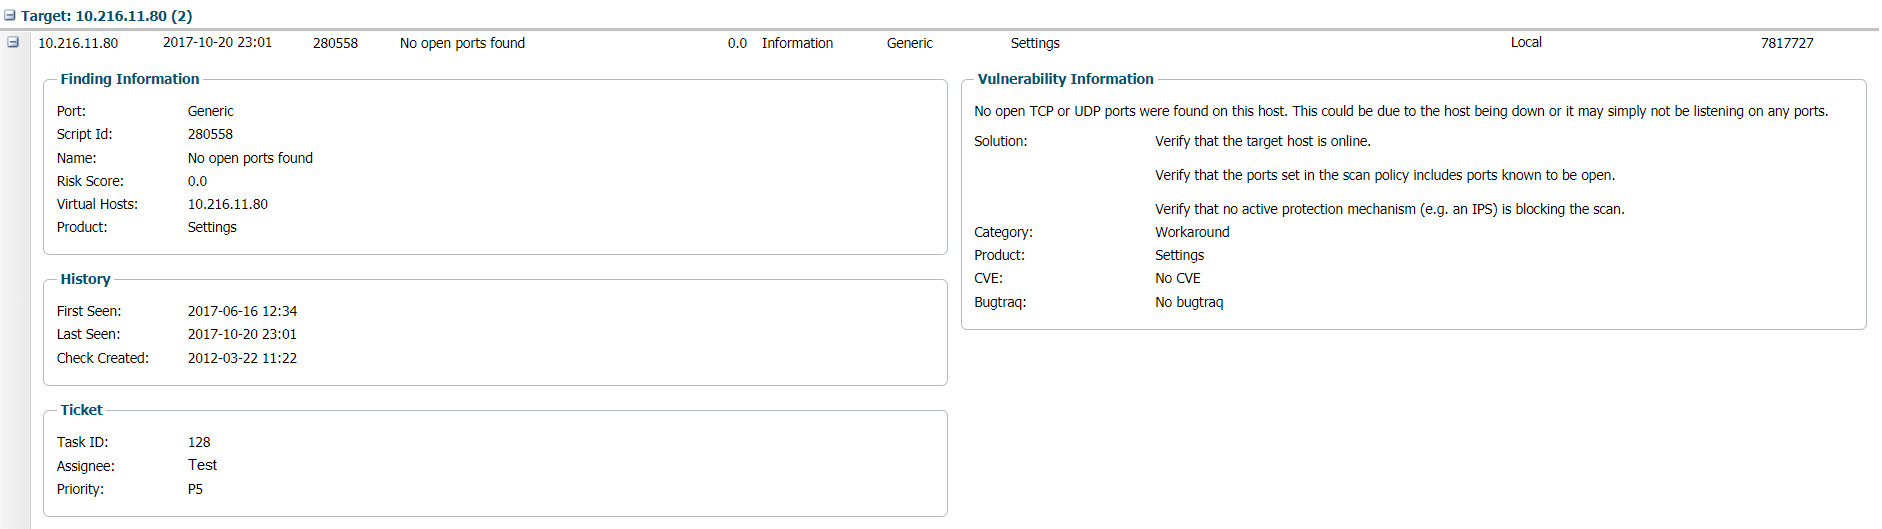
The Findings tab lists all the findings that were found based on the target selection in the Select targets for reporting area. Click on + located to the left of the target name, to view complete details.
Customizing Reports Based on Findings
By clicking the arrow next to the name of any column, you are provided with a drop-down menu as shown below. Click on Columns to view the available columns.
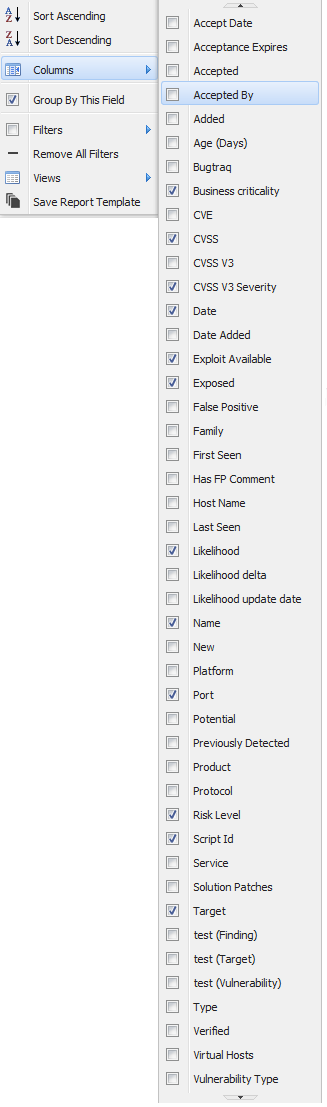
Columns
Select a specific column to know that information about a finding. Selected columns are displayed in the Findings tab. The available options are described below.
|
Option |
Description |
|---|---|
|
Accept Date |
Date when the risk was marked as accepted. |
|
Acceptance Expires |
The date when the risk is not considered accepted anymore. |
|
Accepted |
Displays if the risk is accepted or not. |
|
Accepted By |
Displays the username, by whom the risk was accepted. |
|
Added |
Flags if the finding was added during Scanning Less Scanning (SLS). |
|
Age (Days) |
Shows how old the vulnerability is. |
|
ARN |
Only available if AWS has been enabled. The AWS Amazon Resource Name (ARN) for the target. |
|
Bugtraq |
Bugtraq ID of the vulnerability. |
|
Business Criticality |
This attribute describes how important the target is.
|
|
CVE |
Common Vulnerabilities and Exposures (CVE) entry of the vulnerability. |
|
CVSS |
Score of the vulnerability according to the Common Vulnerability Scoring System (CVSS) v2.0 |
|
CVSS V3
|
Score of the vulnerability according to the CVSS v3.0. |
|
CVSS V3 Severity |
Severity level of the vulnerability according to the CVSS v3.0. |
|
Date |
The date when the vulnerability was found. |
|
Date Added |
The date when a specific entry was added. |
|
Exploit Available |
Determines if there is a publicly available exploit present for this vulnerability. |
|
Exposed |
This attribute determine if the target is exposed to the internet or not. |
|
False Positive |
Shows if the vulnerability has been marked as a false positive. |
|
Family |
The name of the family which the vulnerability belongs to. |
|
First Seen |
Date shows when the finding was first discovered on a specific target during recurring scans. When not found in a scan, the first seen date resets. |
|
Has FP Comment |
Flags if the finding has a false positive comment. |
|
Host Name |
The configured host name for the target. |
|
Instance ID |
Only available if AWS has been enabled. The AWS instance ID of the target. |
|
Last Seen |
Date shows when the finding was last seen on a specific target. Checks if the finding is present in recurring scans. If it is not found in one scan, the last seen date resets. |
|
Likelihood |
The Risk score shows the likelihood of a vulnerability being weaponized and exploited in the wild over the next 12 months. |
|
Likelihood Delta |
Change in the likelihood of a vulnerability being exploited. |
|
Likelihood Update Date |
The last date when the likelihood was updated. |
|
Name |
Name of the vulnerability. |
|
NetBIOS
|
The NetBIOS name of the target. |
|
New |
Check if the finding was present in the previous scan and flags it as new if it was missing from that scan. |
|
Platform |
Detected platform of the target. |
|
Port |
Displays on which port the vulnerability was found. |
|
Potential |
Flags if this finding has been marked as a potential false positive by the system. |
|
Previously Detected |
Shows if this vulnerability was detected in previous scan. Checks if the finding has been detected for the same target previously, not only against the last scan as New does. |
|
Product |
Shows the vulnerable product. |
|
Protocol |
Displays the protocol used (ICMP, IGMP, TCP, UDP). |
|
Risk Level |
Displays the risk level of the vulnerability (High, Medium, Low, Informational). |
|
Scanner (HIAB only) |
Name of the scanner on which the scan was executed. |
|
Script ID |
ID of the script which detected the vulnerability. |
|
Service |
The service that was found on the port. |
|
Solution Patches |
Displays patches needed to remediate specific vulnerability. Applies to Windows targets only.
|
|
Target |
IP address of the target. |
|
Type |
Displays the type of the finding (Port, Information, Vulnerability). |
|
Verified |
Shows if the vulnerability has been verified. |
|
Virtual Hosts |
The virtual hosts for which the vulnerability has been reported. |
|
Vulnerability Type |
Displays what kind of vulnerability the finding is. |
The assigned ticket holder name can now be viewed under the details of that finding.
The information displayed is included in the report. To add relevant custom attribute columns, go to Main Menu > Settings > Account > Attributes. It can also be used for additional filtering.
Group by this field
Most of these columns allow filtering, which gives you the option to display a subsection of the available data. To group or ungroup the grid, click the arrow next to the column name and select/deselect Group by this field. After grouping, all entries with similar values are displayed together in a group.
Filters
To enable filters, open the drop-down menu and select Filters. Depending on the existing kind of data within the column you attempt to filter, you are presented with various options. See Filters for more details.
Views
To save the current view of the findings grid which includes current filters and displayed columns, click the arrow next to the column name and select Save View. After adding the view, you can either Delete View or directly click on the name of saved view to view the respective settings.
Views are beneficial when you wish to see only selected columns. For example, host name and risk level.
Save Report Template
After adding the desired columns and respective filters, you can create a template by selecting Save Report template. This functionality allows you to save the current settings/view of Reporting Tools. Whenever you are selecting a report template, note that the latest report template is shown for the selected targets/scan job. You can either select to overwrite an old report template or create a new one.
Create Dynamic Target Group
This option does not show up if you do not have any filter. To create a dynamic group based on scan results, click the arrow next to any column name and select Create Dynamic Target Group. The currently applied filtering is used, and any target in the latest scan that has findings matching these filters are included in the group. When a new scan for a target is completed, the groups are updated based on the previously set dynamic group filters.
Scanning Multiple Virtual Hosts
Scanning targets with multiple virtual hosts will result in one finding per each virtual host and port combination allowing a greater granularity in risk evaluation and remediation. This applies to scans ran with Normal or Normal with Webapp policy (or derived from these).
Functionalities of Findings
The following actions are possible when you right-click on a finding:
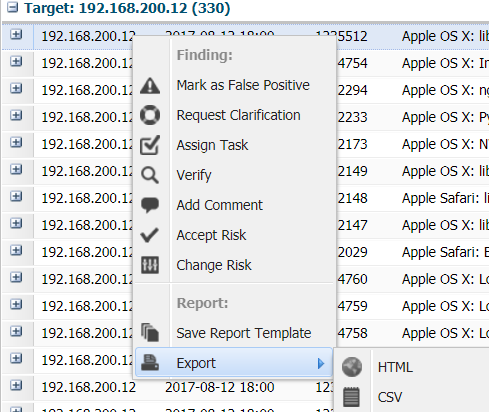
Mark as False Positive
Marks this finding as a false positive. While creating the scan policy for a scheduled scan, you have an option to disable the script, so that the script does not run again. You can send additional information to the Outpost24 Technical Service team if you select to inform about the problem. This information is used to further improve the vulnerability database. To unmark an entry as a false positive, select Unmark as False Positive. A false positive is still listed in the results but marked as a false positive in the exported report.
It is not possible to delete individual findings from a report.
Request Clarification
Request clarification from the Technical Service team regarding the finding.
Assign task
Assign task option lets you set the priority on the finding. P5 is highest by default. It can be customized in the ticket system. Include a due date, add an assignee, and supply additional comments. There are two types of ticketing systems.
|
Option |
Description |
|---|---|
|
Internal |
The default ticketing system which is used in OUTSCAN/HIAB. |
|
External |
This can be configured using the Integrations tab (Main Menu > Settings > Integrations). |
Verify
Starts a verification scan that checks if the finding is still existing on the target.
Result of the verification test is present in the report and as a field in the report grid. It can be either be still present or no longer present.
When you click on Verify finding on HIAB, a new warning message pops up.
Verify scans are a best endeavor to see if a vulnerability still exists. There may be some elements of the verify scan which do not work under certain conditions and we cannot guarantee against false positives or false negatives. if you require more accuracy, please re-run a vulnerability scan against the target.
Add Comment
This functionality allows you to add a comment to the vulnerability, which is included in all findings of this vulnerability. The show comment on all findings option adds the comment to the vulnerability database. This makes it visible in all future reports.
Accept Risk
Certain tasks like accepting multiple risks at once can take a long time. When it takes more than 90 seconds, the progress can be viewed in the Task Viewer tab located at the bottom right of the task bar. Task Viewer appears for a user only if there is at least one task in the list. The three possible states for a task appearing in Task Viewer are:
-
In Progress
-
Done
-
Error
This functionality allows you to set the number of days to accept the risk of this vulnerability. The accepted risks show up in the finding information and in the exported reports. You can set to allow it forever and can also add a comment why it has been accepted.
There are different options available for accepting a risk:
|
Option |
Description |
|---|---|
|
Accept forever |
Select if accepting risk forever. |
|
Accept for number of days |
Set number of days to accept risk. |
|
Accept until |
Set date until to accept risk. |
|
Targets |
|
|
Comment |
Add explanation for accepting the risk (not mandatory). |
|
Set as Default |
This option is available only for the Main User or the Super User. If this option is enabled, the settings in the window are saved as default settings. |
Select the Any option to accept the risk of this vulnerability for corresponding targets. If this finding is still existing during the next scan, it automatically imports the acceptance settings as of the previous scan.
Remove accepted risk: This removes the risk acceptance on all the selected vulnerabilities. Select an option to remove the risk acceptance for respective vulnerabilities.
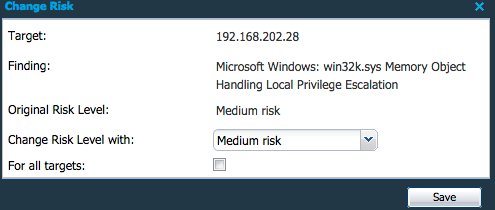
Change Risk
This functionality allows you to modify the risk level for a specific finding/vulnerability. Once selected, a window is displayed which allows you to change the risk level from a drop-down menu. After selecting a preferred risk level press the Save button. Any updated risk level is displayed in italics in the portal interface.
Save Report Template
After adding the desired columns and respective filters, you can create a template by selecting Save Report template. This functionality allows you to save the current settings/view of Reporting Tools. Whenever you are selecting a report template, note that the latest report template is shown for the selected targets/scan job. You can either select to overwrite an old report template or create a new one.
Create Dynamic Target Group
This option does not show up if you do not have any filter. Create a dynamic group based on scan results. The currently applied filtering is used and any target in the latest scan that has findings matching these filters is included in the group. When a new scan for a target is completed, the group is updated based on the previously set dynamic group rules.
Export
Exports the currently visible data from the grid to one of the below formats.
|
Format |
Description |
|---|---|
|
Export HTML |
This option takes you to a HTML page with data which can be saved or copied from. |
|
Export CSV |
This provides you with Comma separated value list exported as a .csv file. The CSV export function in the grid has a limit of 100k rows.
|
Solutions
The Solutions tab provides a graphical overview of the top solutions for the vulnerabilities listed in the Findings tab. The information presented here helps an organization to quickly identify solutions that resolves multiple vulnerabilities and thus helps in planning and prioritizing tasks.
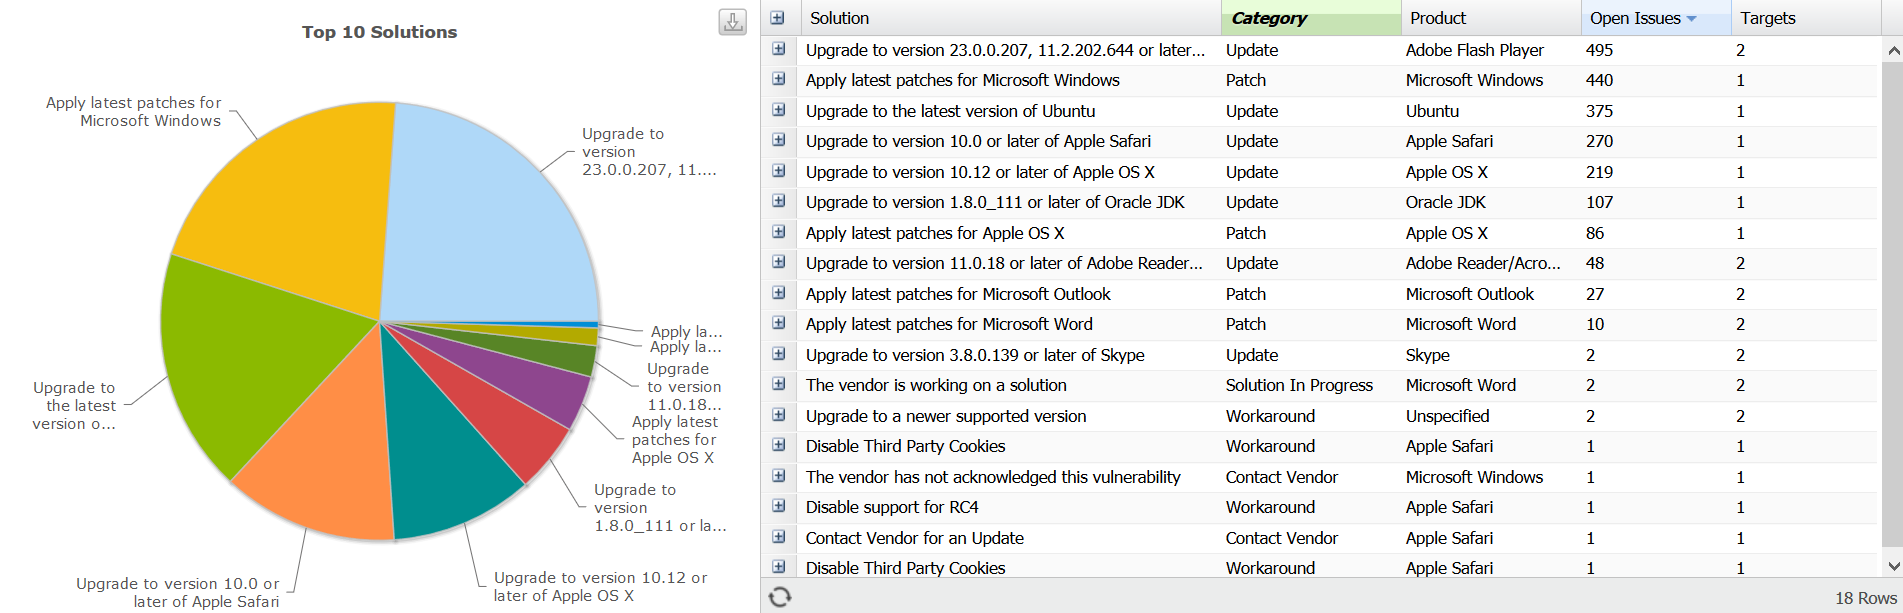
The solutions grid on the right side is configurable and includes the following columns:
|
Column |
Description |
|---|---|
|
Category |
Describes the type of the solution. |
|
High Risks |
Number of vulnerabilities identified as high risk. |
|
Medium Risks |
Number of vulnerabilities identified as medium risk. |
|
Low Risks |
Number of vulnerabilities identified as low risk. |
|
Open Issues |
Number of issues that can be resolved by applying the given solution. |
|
Product |
Displays the product to which the solution is applicable. |
|
Solution |
Indicates if there is an existing solution to the identified vulnerability. |
|
Targets |
Number of targets affected. |
By clicking on a specific solution in Pie Chart or solution grid, a small grid is displayed in the bottom of the window which shows a detailed view of the relevant vulnerabilities.
Overview
The Overview tab displays graphs using the vulnerability information from your report. The different graphs are described below.
Family vs. Count
Overview based on Family vs. Count - Number of findings in each script family.
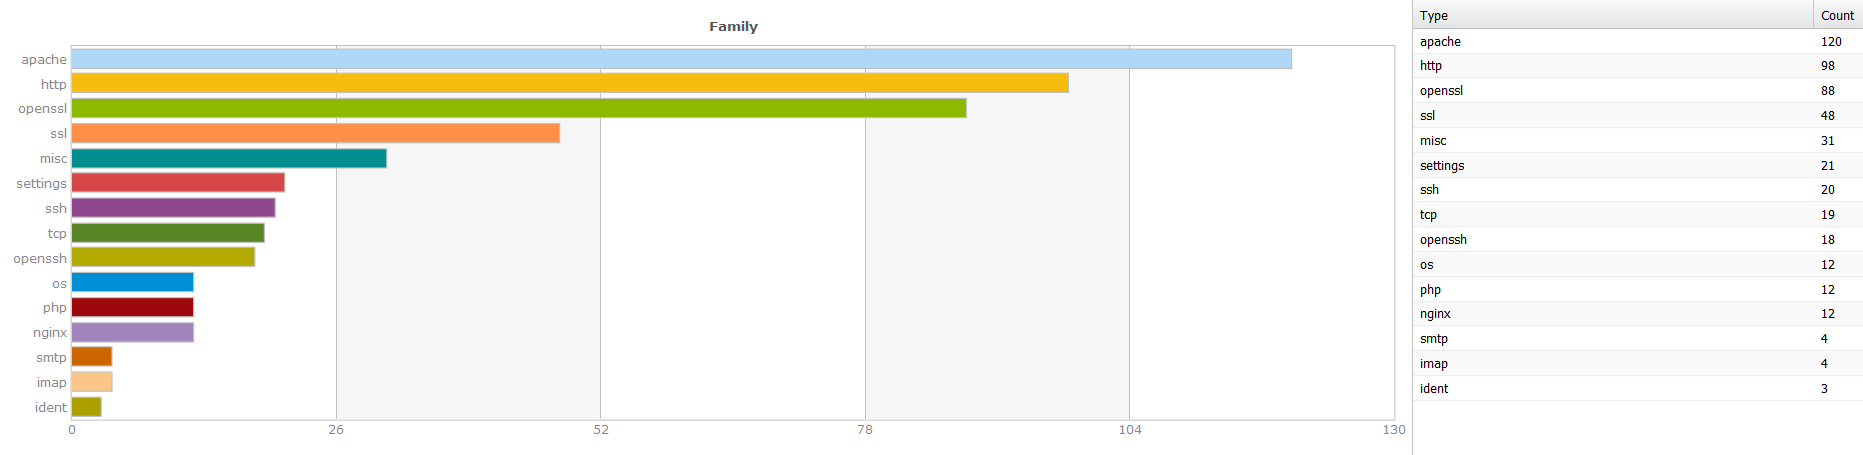
This graph helps in identifying the number of vulnerabilities associated with a specific family type. The associated tabular column has two fields:
|
Field |
Description |
|---|---|
|
Type |
Representing family type. |
|
Count |
Number of vulnerabilities identified. |
Port vs. Count
Overview based on Port vs. Count - Number of findings on each port.
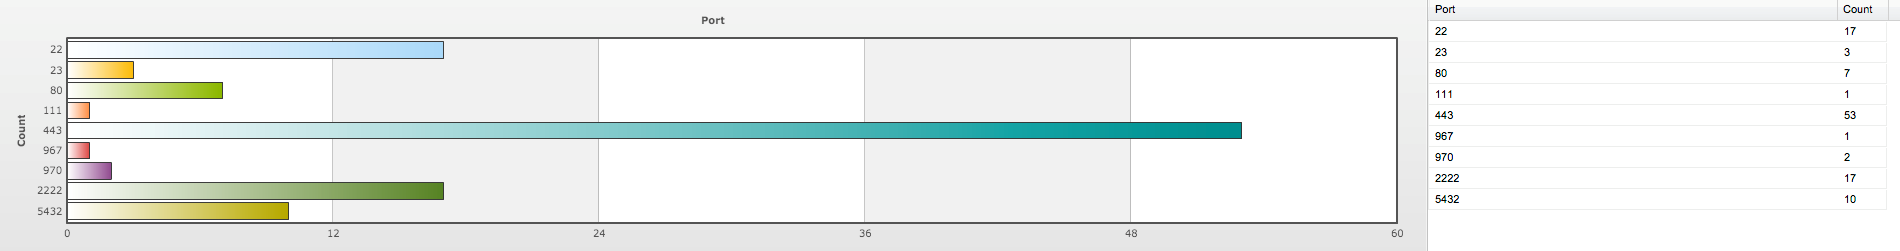
This graph helps in identifying the number of vulnerabilities found on a specific port. The associated tabular column has two fields:
|
Field |
Description |
|---|---|
|
Port |
Port number. |
|
Count |
Number of vulnerabilities identified. |
Risk vs. Count
Overview based on Risk vs. Count - Number of findings with risk levels, Low, Medium, and High.

This provides a graphical bar, which helps in identifying the number of findings classified based on risk levels. The associated tabular column has two fields.
|
Field |
Description |
|---|---|
|
Risk |
Indicates the Risk level of the findings. |
|
Count |
The total number of findings. |
Accepted Risk vs. Count
Overview based on Accepted Risk vs. Count - Number of findings marked accepted risk with risk levels, Low, Medium, and High.

The final section of the Overview tab indicates the accepted risk levels of the total number of accepted risks:
|
Field |
Description |
|---|---|
|
Accept Risk |
Indicates the risk level for the accepted risk. |
|
Count |
Number of accepted risks. |
Trend
The Trend tab displays the vulnerability evolution for a target over time. It is possible to select different time spans to be presented. It also provides a timeline of how risk has been handled, thus helps the risk remediation process. The available graphs are:
-
Number of Findings for Each Risk Level
Displays a graph of the total number of findings at each risk level during the selected time span.
You can select the required time span from the bottom left of the window.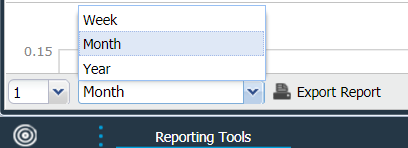
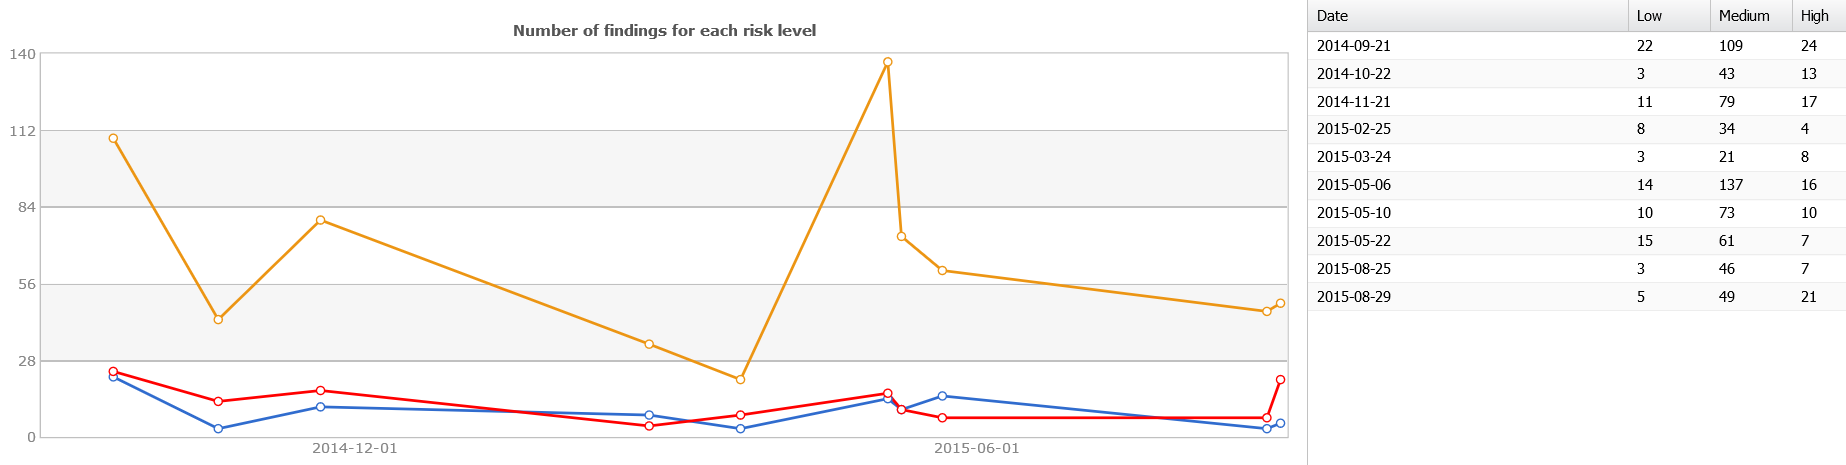
The tabular column provides information about date and the different risk levels associated with the findings.
-
Number of Accepted Risks for Each Risk Level
Displays a graph of the total number of accepted risks at each risk level during the selected time span.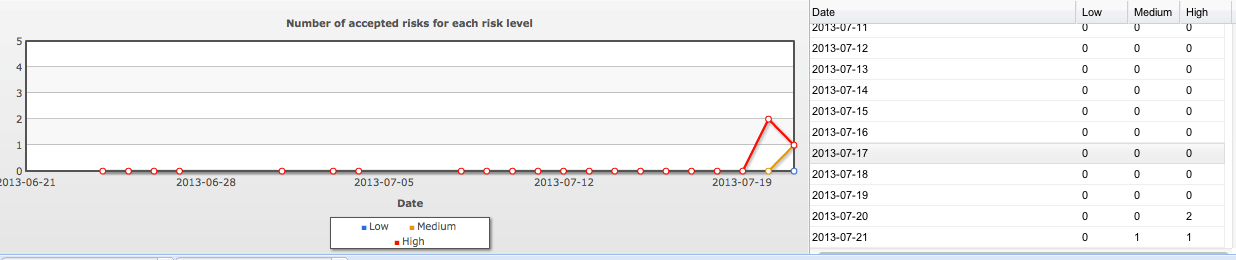
The tabular column provides information about the date of the scan and the corresponding risk levels of the accepted risks.
-
Delta Findings for All Targets
Displays a graph of the total number of delta findings for all targets during the selected time span.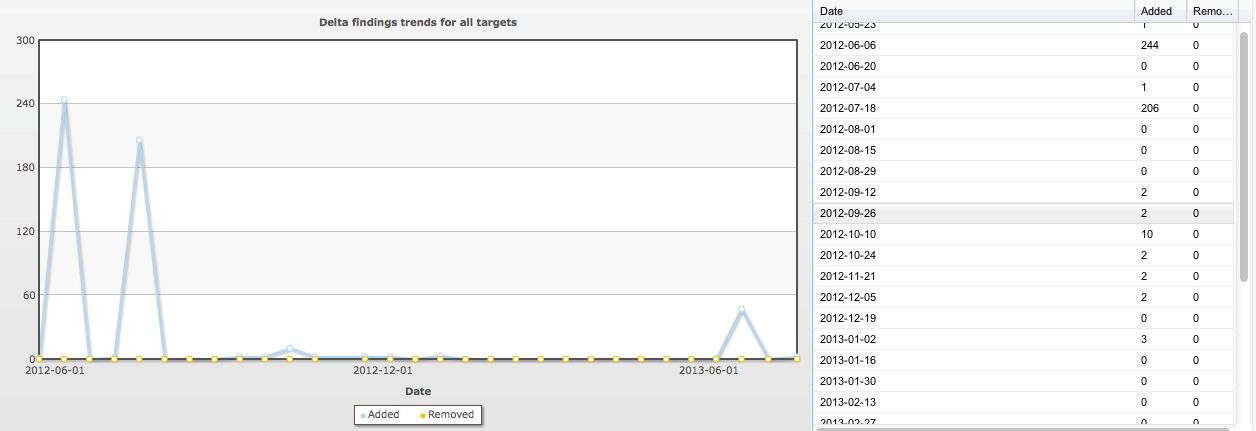
The associated tabular column shows the date and number of findings added/removed on all targets for that specific date.
-
Delta Port Trends for All Targets
Displays a graph of the total number of delta port trends for all targets during the selected time span.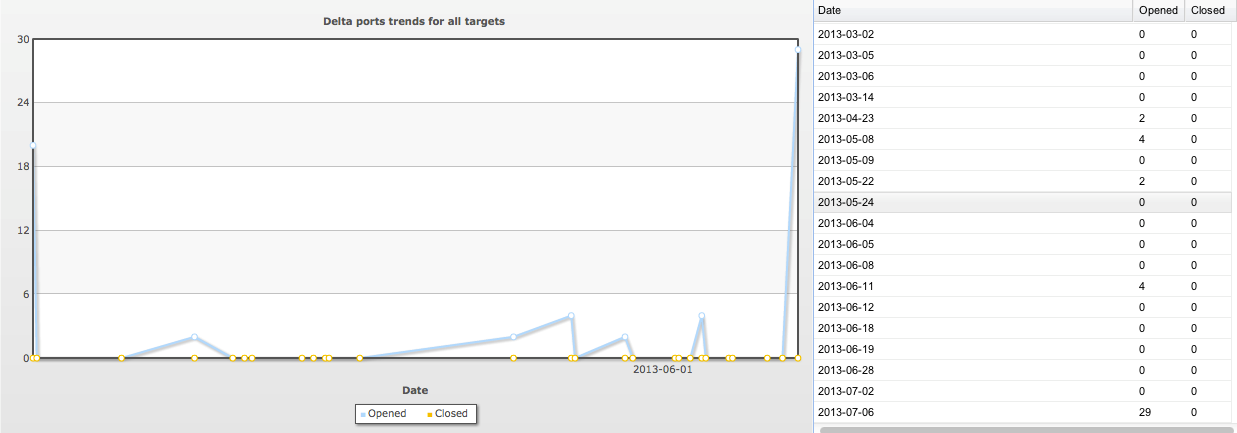
The associated tabular column shows the date and the changed open/closed ports on all targets for that specific date.
Export Reports for Trend and Group Trending
The Export button below on the left corner in the Trend tab helps you generate trend reports. The trend and the group trending information is very useful during formulation of risk remediation strategies
Delta
The Delta tab helps to compare two scans for each selected target and show the total delta of all those targets. You can select the report for comparison based on the time it was generated.
Options are available at the bottom left of the window.
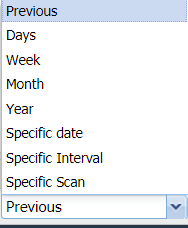
Your selection changes what scans are selected for each target.
When Month is selected, the most recent scan is compared with the earliest scan with the same scan policy within one month. If you have multiple scan policies in different schedules for the same target, the latest scan occurrence (regardless of scan policy) will be compared with the earliest of the same policy.
If you want to get a delta of a specific scan policy, you have to select an appropriate scan schedule in the Scan Schedule window. If you do not select a scan schedule, it uses the latest for each target.
When you use Previous, the second scan is selected based on the scan schedule in addition to scan policy.
The Delta tab contains two graphs:
|
Graph |
Description |
|---|---|
|
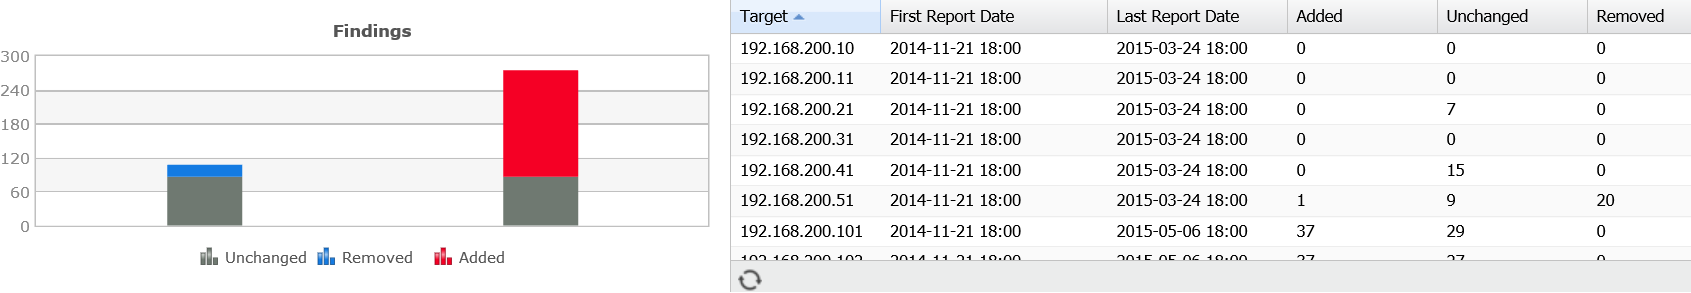
Findings |
Displays the number of added/removed and unchanged vulnerabilities for a target during a chosen period. |
|
Ports |
Displays delta information regarding opened, closed, and unchanged ports. |
It is possible to select and view two different time spans.
Click on the legend (Unchanged/ Removed/ Added) in the graph to view the respective details. This allows you to hit the 1 added vulnerability when it is a single pixel on the bar with 1000 unchanged vulnerabilities.
Correlate to the actual findings
By clicking on the graph, it displays the actual findings the section correlates to. Once those are displayed, you can perform the common functions as described in the Findings section.
Export Reports for Delta
Click on Export Report at the bottom to generate a delta report. The delta and the group delta information is very useful in analyzing the changes made, and can be a good guide during allocation of resources for risk remediation.
Scheduling
The Scheduling tab gives you the opportunity to schedule reports to be sent out based on either a target selection or by a report template.
Clicking New opens Maintaining Report Schedule which presents you with the following options:
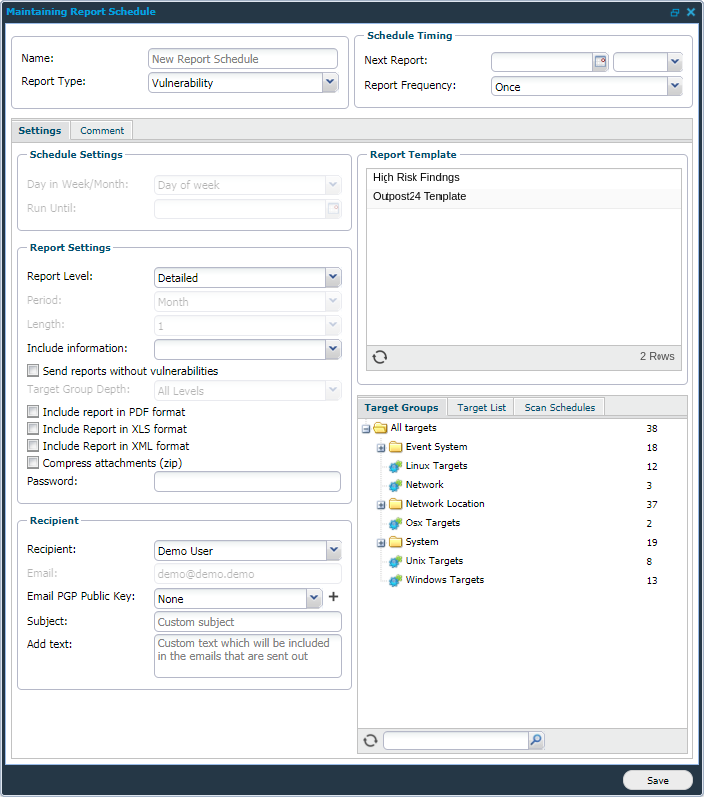
Settings
|
Option |
Description |
|---|---|
|
Name |
Name of the scheduled report. |
|
Report Type |
Define the report type. |
Schedule Timing
|
Option |
Description |
|---|---|
|
Next Report |
The next date and time, this report should be sent to the recipient. |
|
Report Frequency |
How often the report if scheduled. |
Settings
|
Option |
Description |
|---|---|
|
Report Level |
Define how detailed the report should be. |
|
Include Information |
Define what kind of information that is to be included in the report. |
|
Send reports without vulnerabilities |
This feature is used to send the reports even if there are no vulnerabilities present in it. |
|
Include report in PDF format |
Attach the report as a PDF file. |
|
Include report in XLS format |
Attach the report as an XLS file. |
|
Include report in XML format |
Attach the report as an XML file. |
|
Compress attachments (zip) |
It allows you to create a zip attachment which decreases its size. |
|
Password |
Enter a password if you wish to export the report password protected. |
Recipient
|
Option |
Description |
|---|---|
|
Recipient |
Provide a name to whom you wish to send the report. Custom is only available if you have super user privileges. |
|
E-mail PGP Public Key |
An error message pops up when None is selected. You must supply a public PGP key.
|
|
Subject |
Custom subject for email. |
|
Add text |
Custom text which is included in the email. |
Report Template Grid
Choose which Report Template you wish to use:
|
Option |
Description |
|---|---|
|
Target Groups Grid |
Choose which Target Group you wish to include in the report. |
|
Target List |
Enter specific targets you wish to include in the report. |
|
Scan Schedules |
Choose which Scan Schedules you wish to include in the report. |
Comment
This is an optional value which allows you to add additional comments on report schedule. These are shown in Comments column of Report Schedule grid.
Select the scheduled report and click Send Now to send a report immediately.
Steps to Modify and Delete a Schedule
|
Option |
Description |
|---|---|
|
Delete |
Allows you to remove the report schedule that you have currently selected. |
|
Edit |
To edit a schedule, right-click on it and select Edit. |
Text
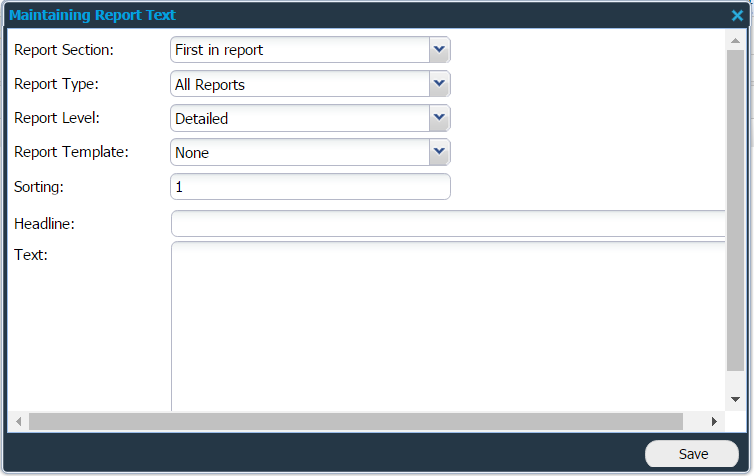
The Text tab allows you to customize the exported reports. This text is added to selected report types in specified section while exporting reports.
Clicking New opens Maintaining Report Text which presents you with the following options:
|
Option |
Description |
|---|---|
|
Report Section |
Choose if you wish to add pages at the beginning or the end. |
|
Report Type |
Select the type of report. |
|
Report Level |
Select the report level. |
|
Report Template |
Name of template for which this custom text is applicable. |
|
Sorting |
Define the order for this page. |
|
Headline |
Add a title to the page. |
|
Text |
Type the text that you wish to include in the report. You may use the following tags to format the text:
|
The grid shows the custom texts that has been configured. The look can be customized by choosing necessary columns:
|
Column |
Description |
|---|---|
|
Headline |
The title of the page added. |
|
Report Template |
Name of template for which this custom text is applicable. |
|
Report Type |
Displays the report type for which the custom text is included. |
|
Location |
Displays where the text is added in the report. |
|
Sorting |
While adding many custom texts at the same location, the sorting value determines the order by which they appear in the report. |
Delete removes the selected entry.
Export Report
A report can be exported using the Export Report option visible on the bottom left of Reporting Tools window. It can be exported from the Findings, Solutions, Trend, and Delta tabs. Reports can be customized using different reporting formats, types, and levels.
Export Report from Findings
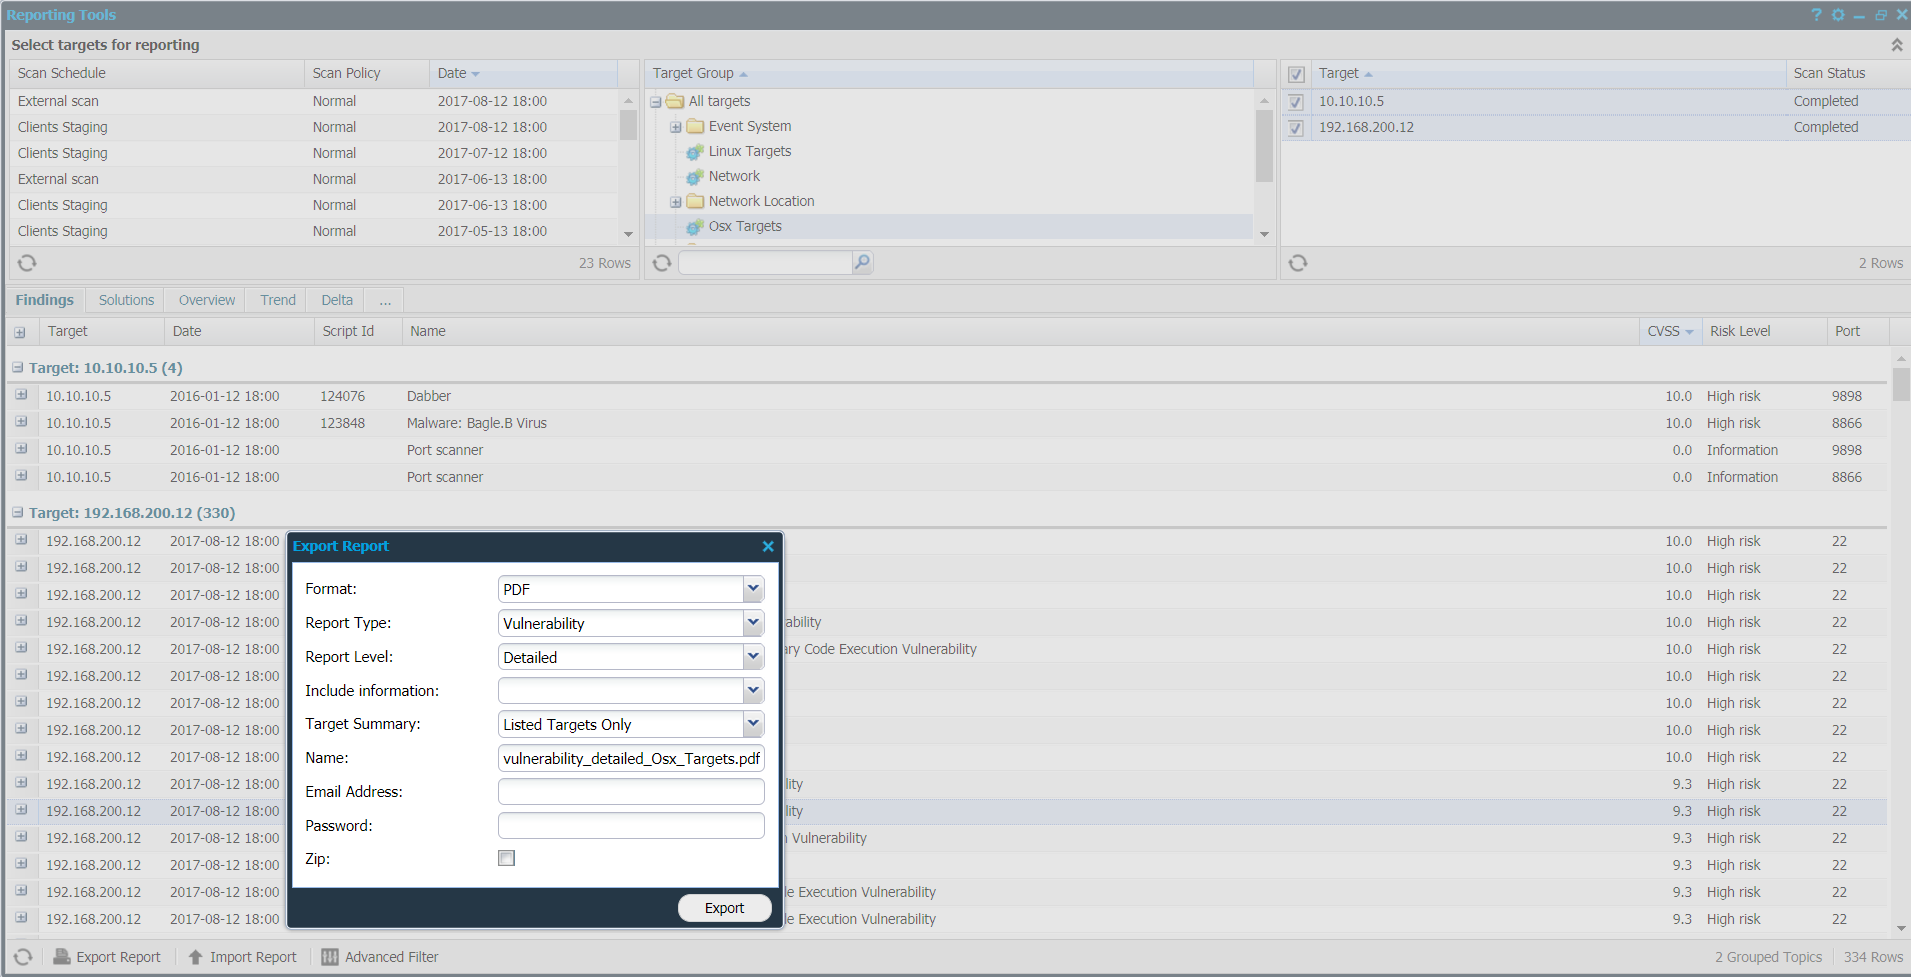
Format
A report can be exported in the most commonly and widely used document formats.
The available reporting formats are as follows:
Formats
|
Description
|
|---|---|
|
|
This is the most commonly used reporting format. The reports generated in PDF format can be password protected. |
|
Excel |
The reports generated using excel format, have a lot of tabular information, which can be useful when reporting information to IT/Security department or similar divisions. |
|
XML |
This format is the default industry standard used for data exchange and integration. The reports generated in XML format are typically used for integration and automation. |
Report Type
Based on the type of scan and the type of information, we can select the corresponding report type. There are three report types:
-
Vulnerability - presents vulnerabilities per each asset
-
Group Vulnerability - presents vulnerabilities per asset group level, useful for comparing business units, geographical locations, etc.
-
Web App Discovery - presents the web URLs discovered during the scan, useful for analysing the scan coverage.
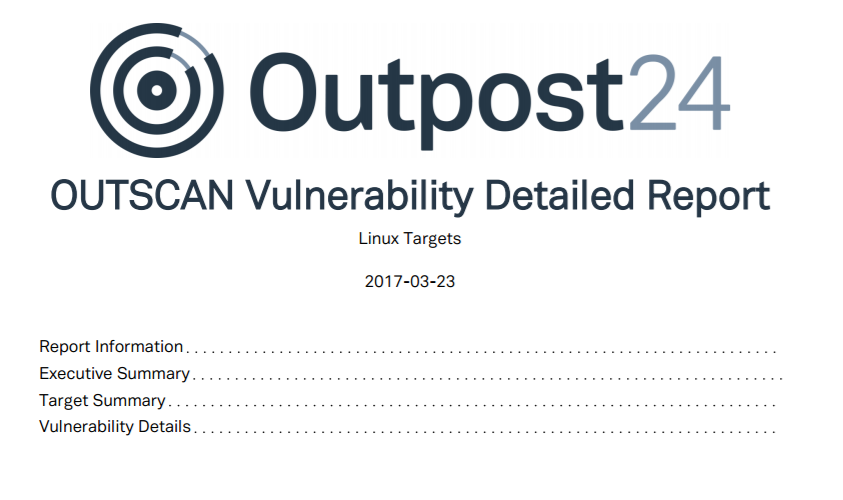
Vulnerability Reporting
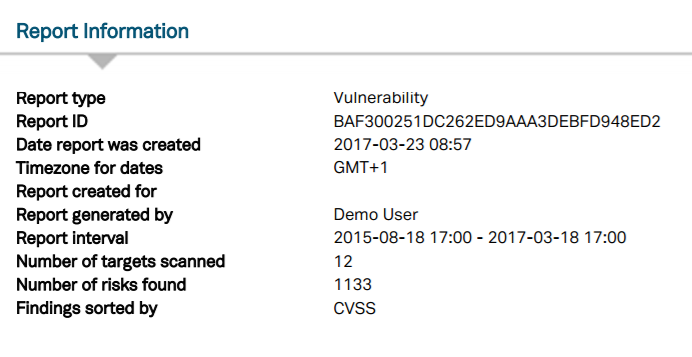
Report Information
This section contains generic information about the report fields as mentioned below.
Executive Summary
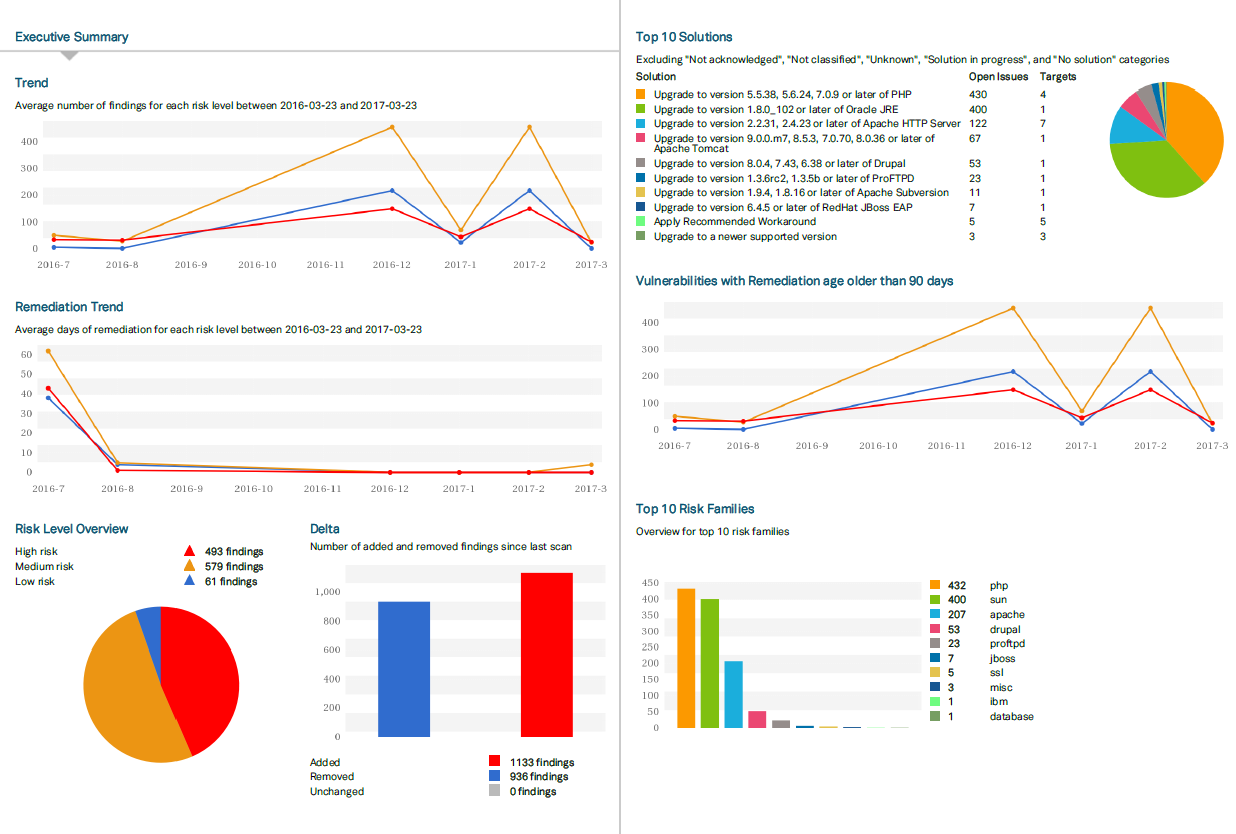
The Executive Summary (figure above) shows the trend information, risk, and solutions. It provides us with graphical information, which is very informative and useful to report findings to the top management. It is user-friendly and an important section of the report. This section is available as default for all the report formats.
Target Summary
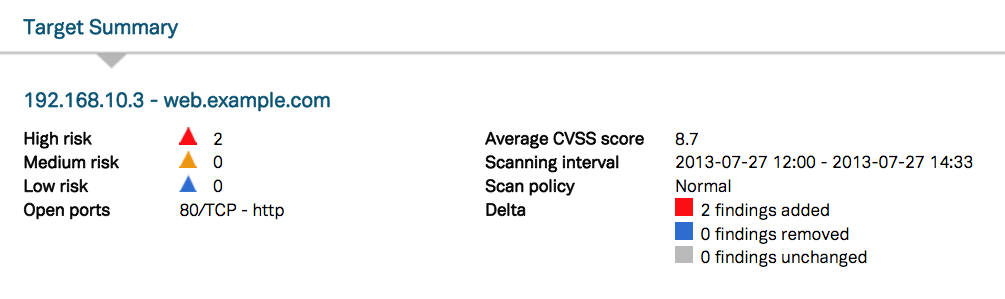
The Target Summary gives an overview of the target information. The information in this field is specific to the target in context. It contains the information about target IP, hostname, open ports, risk levels, scan time, policy, and delta information.
Vulnerability Details
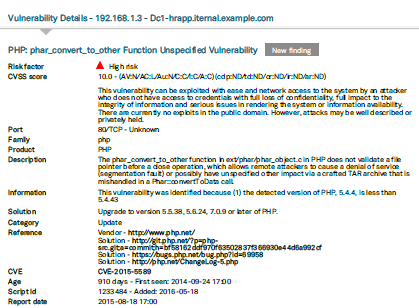
This section provides a comprehensive overview of the findings reported on each target. The complete list of vulnerabilities found on each target is described in detail. The reported findings are explained with the help of risk level, CVSS score, family, source/reference, description of the vulnerability, and information fields. Each vulnerability has a unique script ID.
Modification List
All the changes made to the scan policy or to the targets are reflected here in this section.
Scan Tracking List
This list provides information about scan track ID, which is useful while handling some support cases.
Group Vulnerability Report
This report is used to analyse reported findings for specific target groups and corresponding sub groups. The group vulnerability report is configurable based on selected group under target groups and number of levels set under Target summary. By selecting the Target summary, you can adjust the number of subgroups that need to be a part of the report. The Target group depth follows a top down approach.
If the Target Group Depth is set to two levels for a selected target group, the next two levels of subgroups are included in the report.
In this way, reports for large target groups can be broken down into reports for specific groups and subgroups.
The first two chapters are common for all reports, please refer to Report Type. The remaining sections are as follows:
-
Group Summary
-
Group Details
Plan it correctly
Group vulnerability reports can help large organizations to analyze the risk levels based on organized groups and subgroups and define a plan to remediate risks in an ideal way.
Group Summary
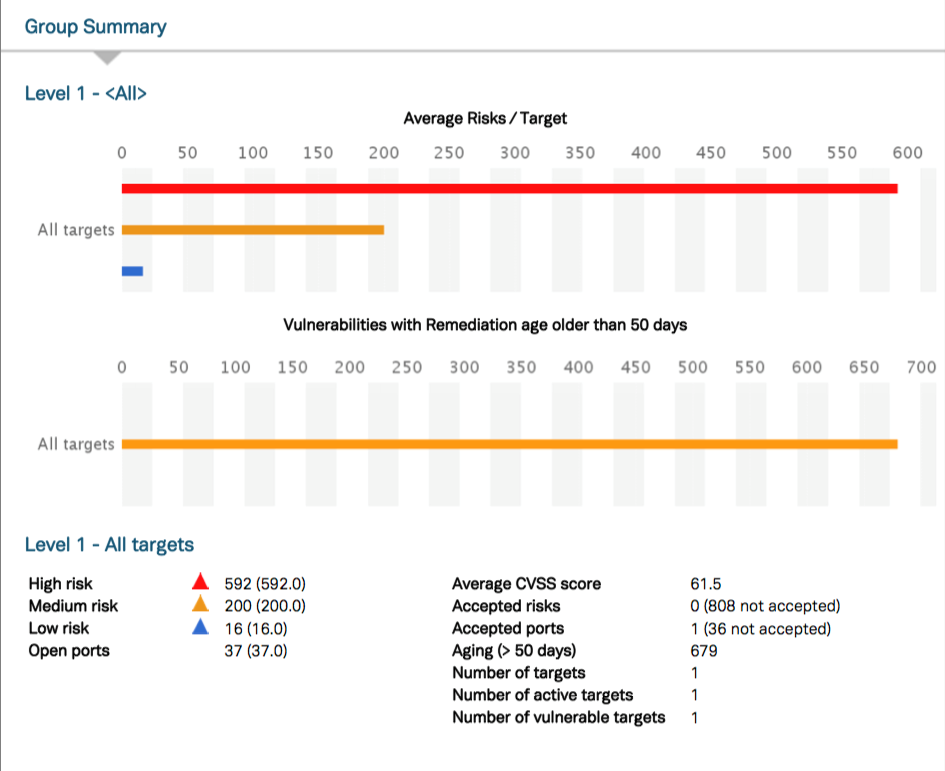
The group summary section provides the information about risk and remediation including the list of findings exceeding a specific age set by user. Number of findings are reported in the group/subgroups. This section of the report also displays the Group level.
Group Details
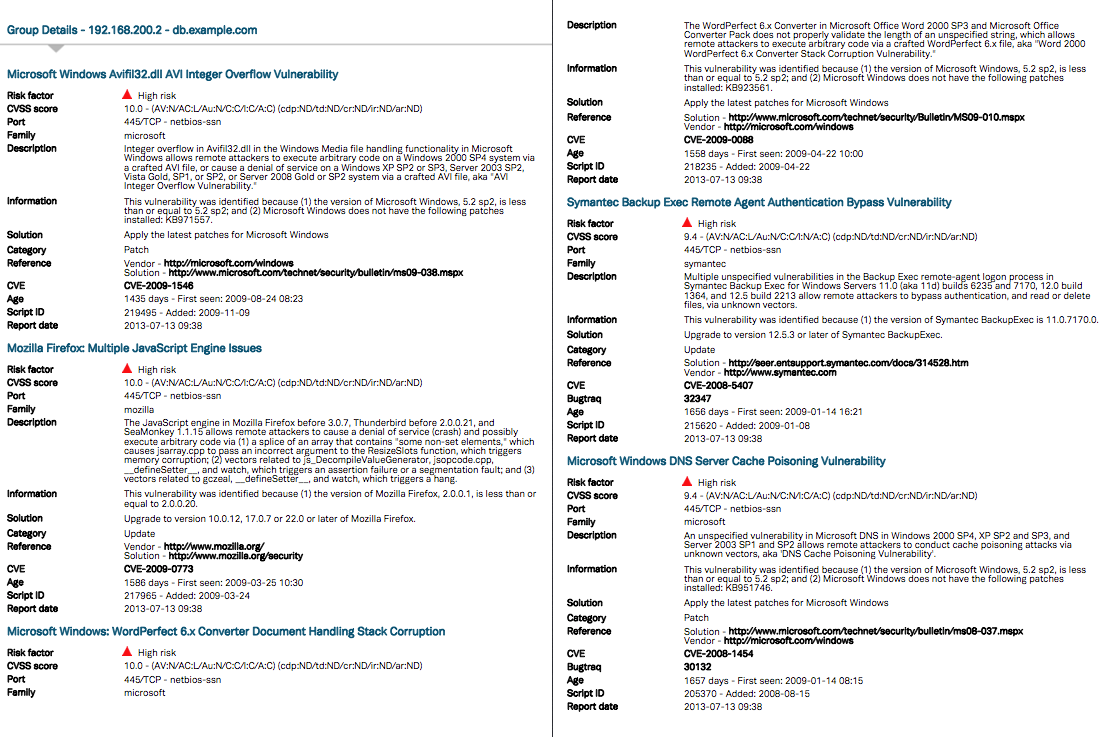
An elaborated explanation for all the findings, in other words the detailed vulnerability report can be found under Group Details. These findings are listed for all targets under the selected group depending on the depth level.
Web App Discovery
This report provides the information about URIs discovered and scanned during a scan. This report can be used when a web app is set enabled under a scan policy.
The web app discovery report has the following chapters:
Report Information
The report information describes the basic information about the report. It consists of fields like report type, report ID, date, time zone, created for/by, number of targets, and report interval.
Executive Summary
The executive summary contains graphical information about URIs (discovered/scanned/external), delta information about number of new and removed URI since the last scan.
Web App Discovery Summary
The web app discovery summary gives numerical information about URIs discovered externally, URIs discovered internally, URI’s scanned, number of virtual hosts discovered, and the scanning interval.
Report Level
|
|
|
The report level helps you manage reports based on management hierarchy. It helps you generate the correct report based on how much information is needed and in which form. It can be observed that the information varies in the figures above, thus making each report exclusive depending on its functionality and audience.
There are three reporting levels:
-
Detailed
-
Summary
-
Management
Detailed
The detailed report is the longest report that can be generated. It has in depth technical information about findings, targets, risk-levels, CVSS, report and additional information about the finding.
As an example, the figure above displays the first page of a vulnerability report with level set to detailed. The report contains six sections and has detailed information about all the vulnerabilities and targets.
This report is directed towards system administrators and security consultants in an organization.
Summary
The summary report is the ideal sized report with report information, executive summary and target summary. This report provides just about the right information required by the IT department of any organization.
Management
The management level report gives us a brief summary of the vulnerabilities and risks reported. It gives a good graphical overview of findings, risks and top solutions. This report is ideal while reporting to higher management.
Other Information
Include Information
This allows you to select which information needs to be added in the report. The available options are:
-
Target Information
-
Scan Modifications
-
Listed target Information
Target Summary
This allows you to select the targets that should be included in the summary overview of the report.
|
Option |
Description |
|---|---|
|
All Selected Targets |
All the targets that has been selected for the scan. |
|
Listed Targets Only |
Restricted to those targets that are listed in the Findings tab. |
All Selected Targets would produce a report regardless if there were any findings or not, and Listed Targets Only would omit those targets with a failed scan status and only produce a report with the targets with a complete scan status and a finding in the finding list.
Name
You should mention the name of the report in this section. If you do not provide any specific name, it creates a name as per the selected options.
Email Address
If you want to send the report via email instead of downloading, provide the email address in this field.
Password
If you want the report to be password protected, you can mention a password here.
Include Attachments (Zip)
If selected, the exported report is compressed with zip compression standard.
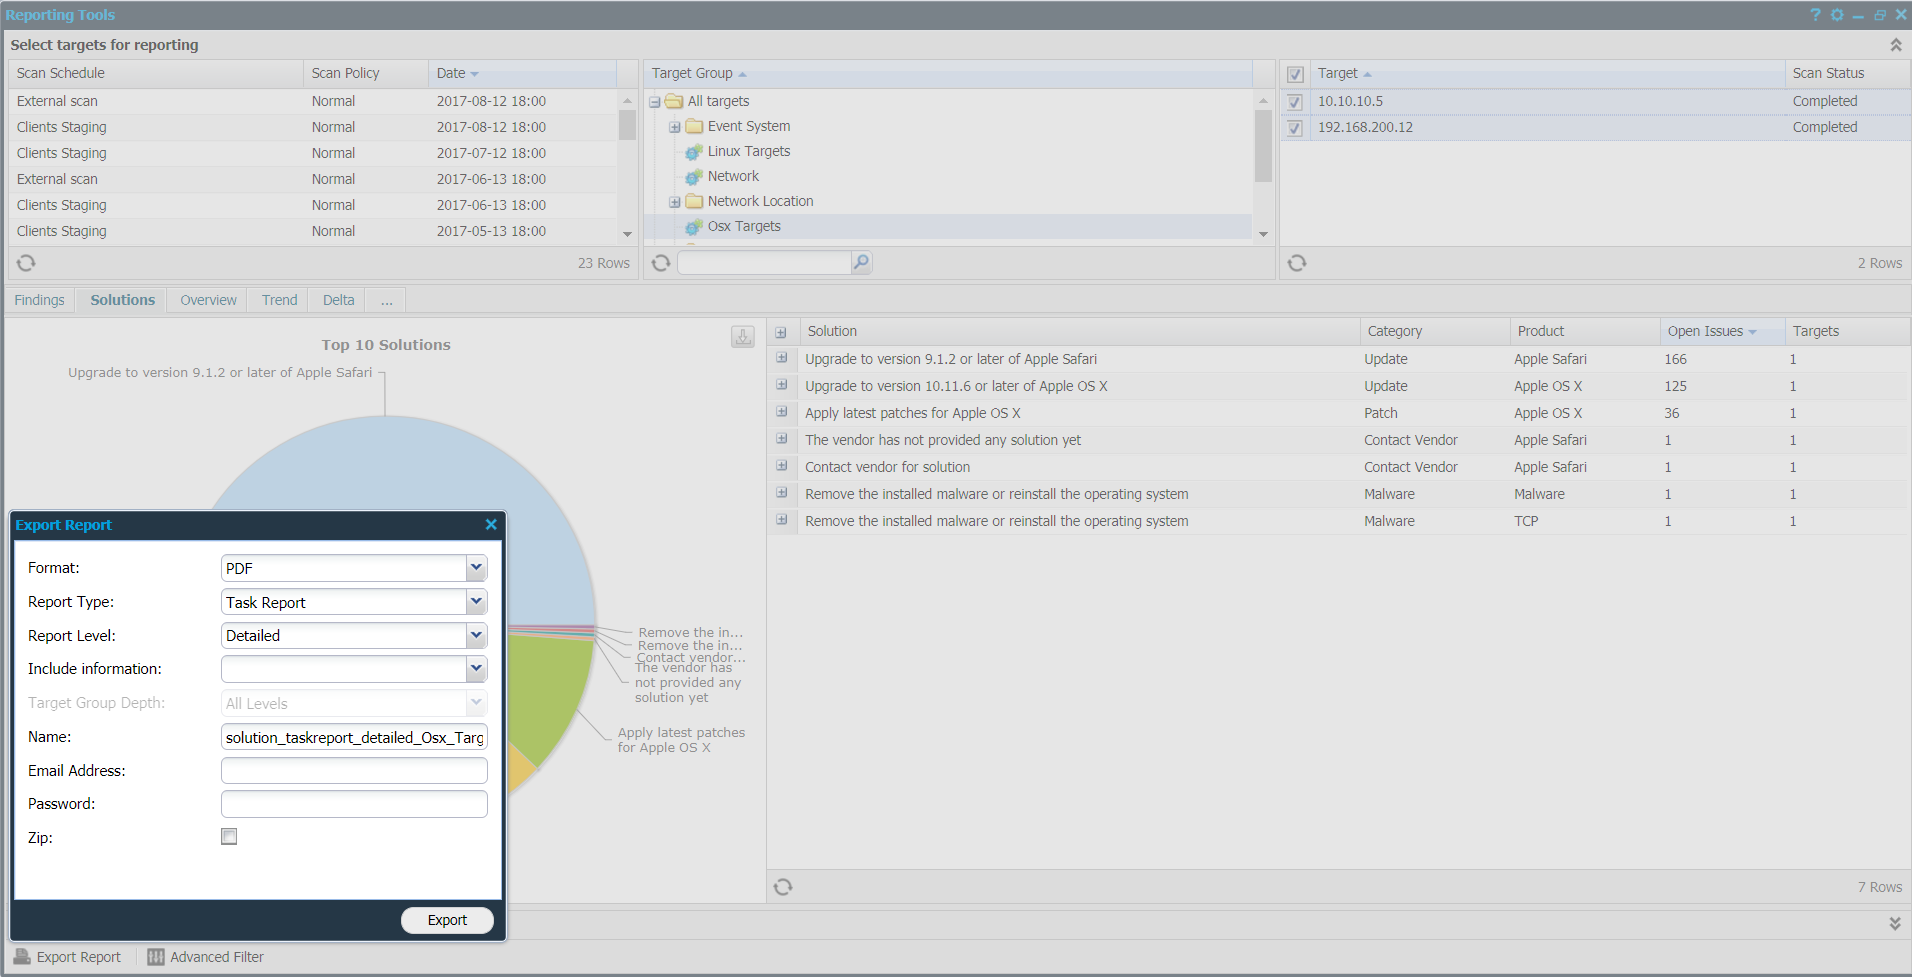
Export Report from Solutions
Often it is difficult for a large organization to identify and plan resolutions to the detected vulnerabilities. The solutions report provides a jump-start to an organization in identifying the solutions, which resolves most vulnerabilities based on reported findings on single or multiple targets.
Format
A report can be exported in the most commonly and widely used document formats.
The available reporting formats are as follows:
|
Format |
Description |
|---|---|
|
|
This is the most commonly used reporting format. The reports generated in PDF format can be password protected. |
|
Excel |
The reports generated using excel format, have a lot of tabular information, which can be useful when reporting information to IT/Security department or similar divisions. |
|
XML |
This format is the default industry standard used for data exchange and integration. The reports generated in XML format are typically used for integration and automation. |
Report Type
There are two types of solution reports:
-
Task Report
-
Target Report
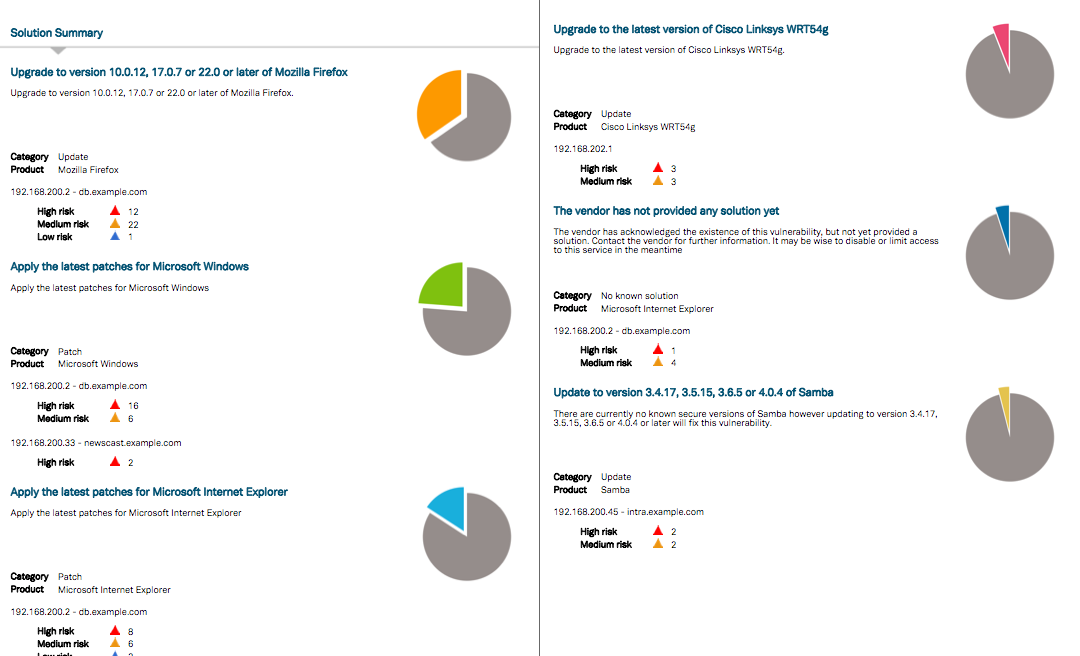
Task Report
This report is used to identify the top solutions and to define a task based approach to resolve the vulnerabilities. The Solutions Summary displays the top solutions distributed in the form of individual tasks. The below figure shows the solutions summary for a task report.
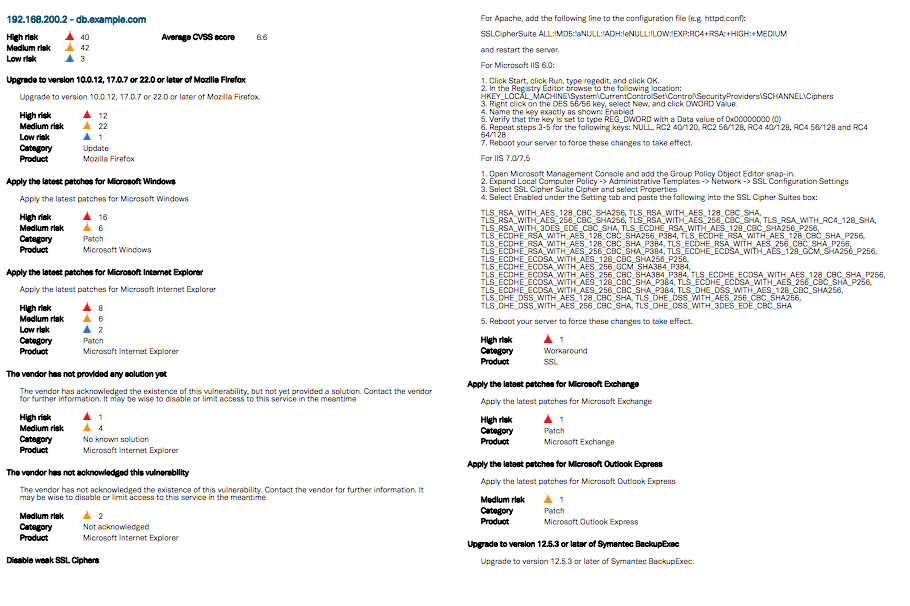
Target Report
This report provides solutions based on targets. It helps us identify all the vulnerabilities for a specific target. The below figure shows the Solution Summary for the target report.
The key difference between Task and Target reports is the approach taken in the Solutions Summary. This flexibility allows an organization to plan remediation in multiple ways, with each solution report having its own benefits.
Report Level
|
|
|
The report level helps you manage reports based on management hierarchy. It helps you generate the correct report based on how much information is needed and in which form. It can be observed that the information varies in the figures above, thus making each report exclusive depending on its functionality and audience.
There are three reporting levels:
-
Detailed
-
Summary
-
Management
Detailed
The detailed report is the longest report that can be generated. It has in depth technical information about findings, targets, risk-levels, CVSS, report and additional information about the finding. As an example, the figure above displays the first page of a vulnerability report with level set to detailed. The report contains six chapters and has detailed information about all the vulnerabilities and targets. This report is mostly directed towards system administrators and security consultants in an organization.
Summary
The summary report is the ideal sized report with report information, executive summary and target summary. This report provides just about the right information required by the IT department of any organization.
Management
The management level report gives a brief summary of the vulnerabilities and risks reported. It also provides a good graphical overview of findings, risks and top solutions. This report is ideal while reporting to higher management.
Other Information
Include Information
This allows you to select which information needs to be added in the report.
The available options are:
-
Target Information
-
Scan Modifications
-
Listed target Information
Name
You should mention the name of the report in this section. If you do not provide any specific name, it creates a name as per the selected options.
Email Address
Enter an email address in this field to send the report via email instead of downloading.
Password
If you want the report to be password protected, enter a password here.
Include Attachments (Zip)
If selected, the exported report is compressed with zip compression standard.
Import Report
A report can also be imported to OUTSCAN/HIAB using the Import Report option visible on the bottom left of Reporting Tools window.
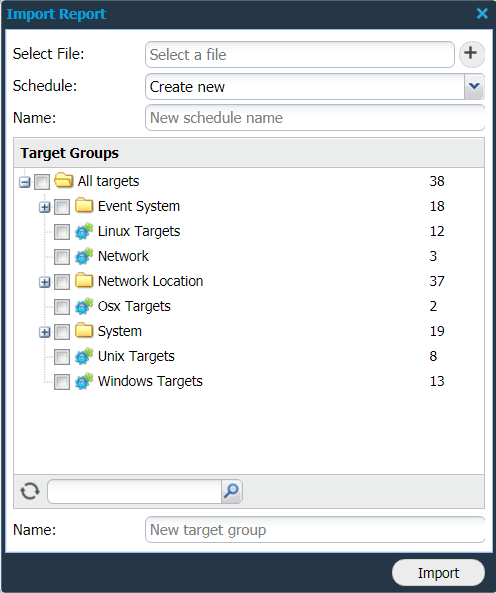
To be able to import a report, the exported report must follow the Outpost24 XML schema standard.
|
Option |
Description |
|---|---|
|
Select File |
Click on + button to select the file from your local folder. |
|
Schedule |
You can create a new schedule or select any of the existing schedules from the drop-down menu. |
|
Name |
If you create a new schedule, provide a name for the schedule in this field. |
|
Target Groups
|
You may select any of the target groups for those you to wish to apply the report settings. You can also search for the target group. |
|
Name
|
Provide a new target group for which the settings should be applied. |
After adding the file and other settings, click Import.
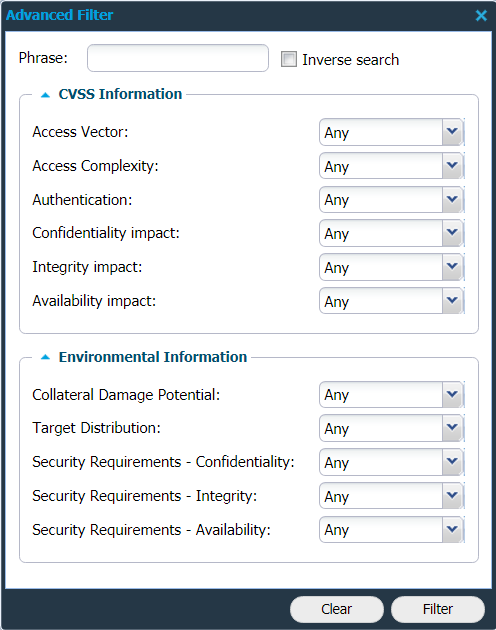
Advanced Filter
Along with the existing filters, you can also use Advanced Filter to further refine your search. This option is available on the Findings, Solutions, and Delta tabs.
|
Option |
Description |
|---|---|
|
Phrase |
Provide any key word or phrase. Searches for the given phrase in nearly 10 descriptive fields and lists all the vulnerabilities. The descriptive fields include vulnerability description, vulnerability comments, vulnerability name, script id, solution, false positive comments, gathered information, accepted risk comments, dispute comment (PCI), and explanation. |
|
Inverse search |
If enabled, searches all findings and lists vulnerabilities whose descriptive fields do not include the given phrase. |
|
CVSS Information |
You can search for findings with desired CVSS Information by selecting the required fields. |
|
Environmental Information |
You can search for findings by providing the Environmental Information and security requirements. |
After adding the required information, click on Filter to check to view the results. These settings also reflect in the exported reports.
To clear the enabled advanced filter settings, click on Clear.
Settings to Customize Report Appearance
To access the report configuration window, click on settings icon located on the upper right corner of the window.
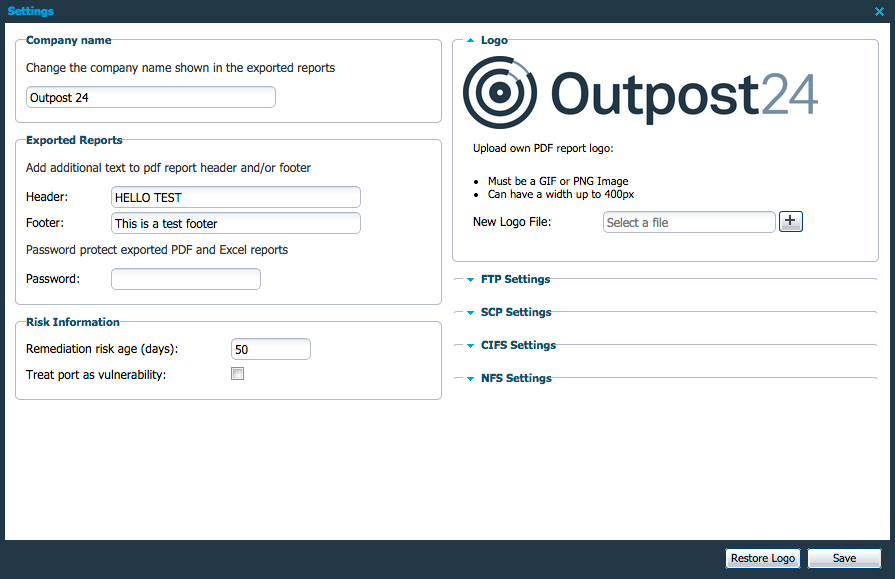
Company Name
Allows you to set the company displayed in the exported report.
Exported Reports
These settings allow you to define additional fields which is presented in the exported PDF reports.
This password applies to all exported and scheduled reports unless they have their own password. Others can view or open the password protected reports only if the password is shared with them.
Risk Information
|
Option |
Description |
|---|---|
|
Remediation risk age (days) |
Sets the remediation risk age. This is displayed as a graph in Group Summary, Solution and Trend reports. This graph pictures vulnerabilities with remediation age older than the entered days. |
|
Treat port as vulnerability |
Checkbox for treating port as a vulnerability. This allows you to perform the same actions on these entries as with normal risks. |
Logo
Change the logo displayed in the report, accepted formats are either GIF or PNG.
FTP Settings (HIAB only)
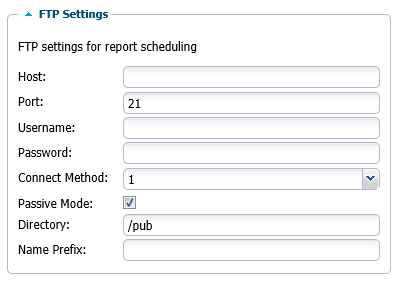
Defining a server here enables the option to send the report via FTP instead of email in the Scheduling tab.
FTP settings for report scheduling:
|
Options |
Description |
|---|---|
|
Host |
Specify the host with which the report needs to be shared. |
|
Port |
Specify networking port. |
|
Username |
Username on the receiving server. |
|
Password |
Password on the receiving server. |
|
Connect Method |
|
|
Passive Mode |
Set active or passive mode. |
|
Directory |
Specify the directory in which the report needs to be saved. |
|
Name prefix |
Name prefix on the report file. |
SCP Settings (HIAB Only)
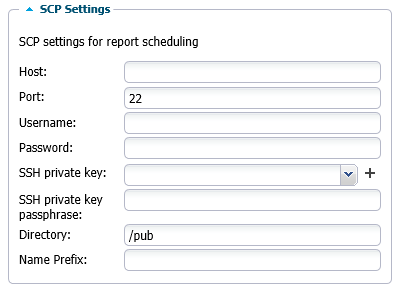
Defining a server here enables the option to send the report via SCP instead of email in the Scheduling tab.
SCP settings for report scheduling:
|
Options |
Description |
|---|---|
|
Host |
Specify the host with which the report needs to be shared. |
|
Port |
Specify networking port. |
|
Username |
Username on the receiving server. |
|
Password |
Password on the receiving server. |
|
SSH private key |
Provide a private key from the receiving server. |
|
SSH private key passphrase |
Passphrase from the private SSH key. |
|
Directory |
Specify the directory in which the report needs to be saved. |
|
Name prefix |
Name prefix on the report file. |
CIFS Settings (HIAB Only)
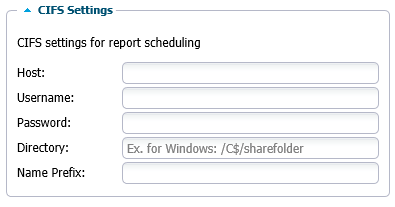
Defining a server here enables the option to send the report via CIFS instead of email in the Scheduling tab.
CIFS settings for report scheduling:
|
Options |
Description |
|---|---|
|
Host |
Specify the host with which the report needs to be shared. |
|
Username |
Username on the receiving server. |
|
Password |
Password on the receiving server. |
|
Directory |
Specify the directory in which the report needs to be saved. |
|
Name prefix |
Name prefix on the report file. |
NFS Settings (HIAB Only)
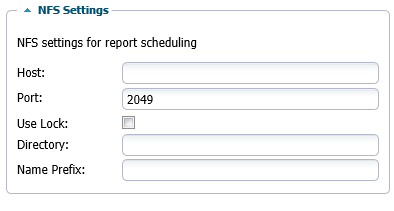
Defining a server here enables the option to send the report via NFS instead of email in the Scheduling tab.
NFS settings for report scheduling:
|
Options |
Description |
|---|---|
|
Host |
Specify the host with which the report needs to be shared. |
|
Port |
Specify networking port. |
|
Use Lock |
Select if using nfslock allowing NFS clients to lock files on the server. |
|
Directory |
Specify the directory in which the report needs to be saved. |
|
Name prefix |
Name prefix on the report file. |